





















Key Takeaways
- Customer lifetime value gains from mobile apps come mostly from frequency: one peer-reviewed study found adopters bought 33% more often, spending 36% more net of returns.
- Retention gains compound: lifting repeat probability from 50% to 55% adds 11% to expected orders, versus 7.7% when starting from 30%.
- Ask for push permission after a meaningful action, not at launch; Airship found onboarding campaigns lift opt-in to 40% above category average.
- Apps raise spend when customers keep using them: spending fell after app abandonment in one study, and after adoption in a price-competitive category.
- Make loyalty visible in the app; McKinsey found paid-program members 60% more likely to spend more, versus 30% for free programs.
- Give subscribers a visible pause button in the app; Recurly found 3 in 4 subscribers who pause eventually return.
- Measure app LTV with matched cohorts net of returns and margin; app adopters also returned products 35% more often in one study.
Most Shopify brands can quote their customer acquisition cost to the cent. Ask what a customer is worth after their third order, or how long a first-time buyer takes to come back, and the answers get vague fast.
That blind spot matters. If your first order doesn't cover what you paid to win the customer, all of your profit depends on whether they come back. It's also why so many brands start looking at a mobile app. An app sits on the customer's home screen, remembers who they are, reaches them without paying for an impression, and collects first-party data you can use in every other channel.
But an app doesn't raise lifetime value just by existing. On this question, the academic research is more useful than the vendor pitch. Customers who adopt a brand's app and keep using it buy more often and spend more. Customers who install it and drift away end up spending less. And in one price-competitive category, adoption lowered spending as shoppers used apps to compare deals.
If you're trying to increase LTV on Shopify, this guide shows how to build a customer lifetime value mobile app strategy based on this evidence: what to do at each stage, why it works, when it doesn't, and how to measure the results in your own numbers.
The Short Answer: 7 Steps To Raise Customer LTV With A Mobile App
Use the app to make repeat buying easier, more frequent, and more personal, then measure the effect against similar customers who don't use the app:
- Get the right customers into the app: Promote it to repeat buyers with a clear reason to install, such as early access or loyalty rewards.
- Earn push permission in context and get each customer logged in during the first week.
- Shorten the gap to the second order with order tracking, product guidance and replenishment reminders.
- Build frequency with segmented, behaviour-triggered push and one-tap reorder.
- Raise order value with cart recommendations, bundles and free-shipping progress.
- Keep customers longer with visible loyalty, flexible subscriptions and early churn alerts.
- Measure gross-profit LTV for matched app and non-app cohorts over six to twelve months, net of returns.
What Is Customer Lifetime Value (CLV), And How Do You Calculate It?
Customer lifetime value (CLV or LTV) is the total value a customer generates for your brand across the whole relationship. For DTC brands, the version worth tracking measures profit rather than revenue. A customer who only buys at 40% off can look great on a revenue report and still lose you money.
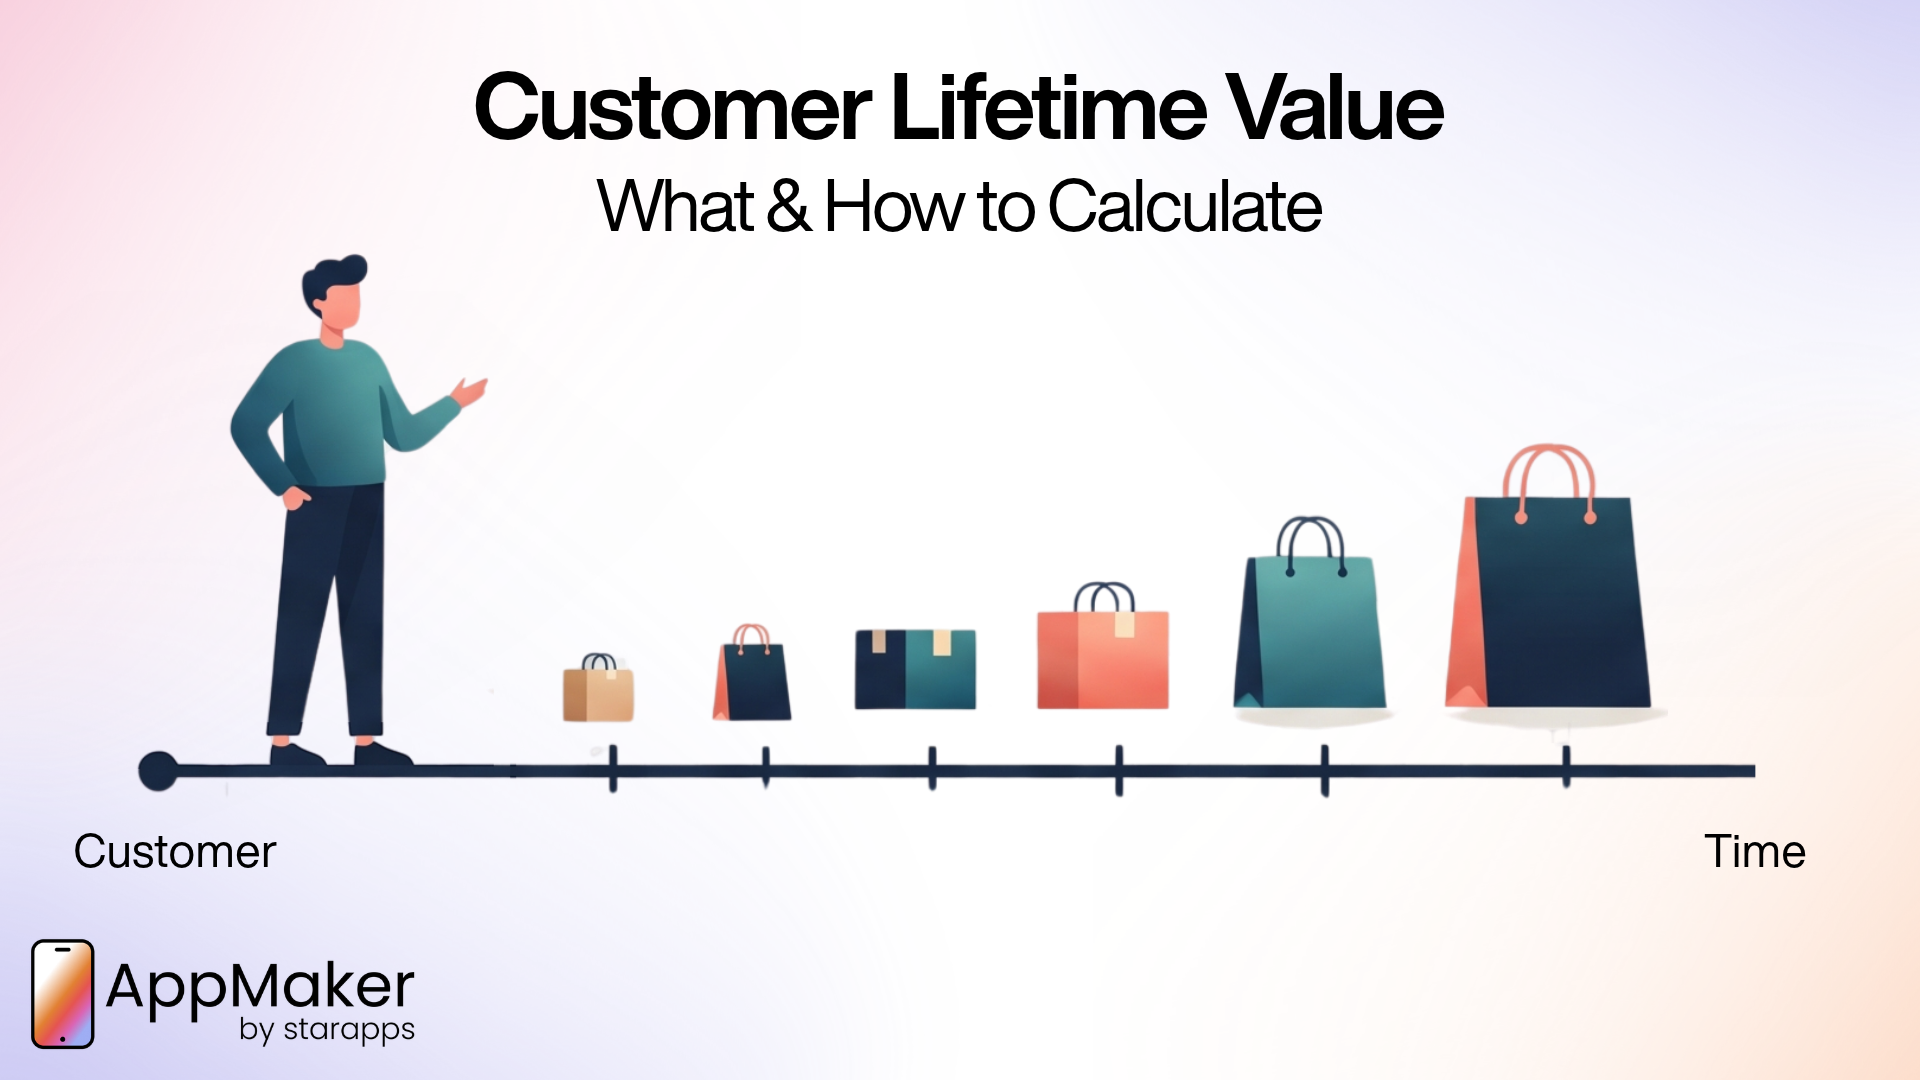
CLV = average order value × purchase frequency × average customer lifespan.
That's fine for a first look. For decisions, use a margin-based version:
Gross-profit LTV = average order value × margin % × expected orders per customer
If you can, use contribution margin: what's left after product cost, shipping, payment fees, and returns.
Retention lives in the last term. If r is the probability that a customer places another order after any given order, the expected number of orders per customer is 1 ÷ (1 − r). A store where 30% of customers reorder averages about 1.43 orders per customer. At 50%, it's 2.
This formula assumes the same repeat probability at every step, and real stores rarely behave that neatly. The odds of a second order are usually different from the odds of a fifth, so model each step with your own cohort data when you can. Even the simple version earns its place, though, because it shows why retention behaves so differently from AOV.
Historical vs. predictive CLV: which should you use?
- Historical CLV adds up what a customer has already spent. It's accurate but only looks backward.
- Predictive CLV forecasts future value from purchase patterns. Shopify offers a predicted spend tier (High, Medium, or Low) as a segment filter. Klaviyo's predictive analytics estimate CLV over a default 365-day window, along with churn risk and an expected date of next order.
Use both. Historical CLV tells you what worked. Predictive CLV tells you where to spend next.
How does LTV relate to CAC and payback?
LTV only means something next to what you paid for the customer. Say an illustrative brand spends $45 to acquire a customer and earns $36 gross profit per order:
| Repeat probability | Expected gross-profit LTV | LTV ÷ CAC | First order covers CAC? |
|---|---|---|---|
| 30% | $51.43 | 1.14 | No, needs a second order |
| 50% | $72.00 | 1.60 | No, needs a second order |
At either retention level, this brand loses money on every customer who never returns. The second order decides whether paid acquisition works at all. And the same ad budget builds a far healthier business at 50% repeat than at 30%.
You'll often see a 3:1 LTV-to-CAC ratio quoted as the target. Treat it as a rule of thumb rather than a measured ecommerce benchmark, and track payback time next to it.
The FORM model: the four levers that drive customer LTV
Every tactic in this guide moves one of four levers. We call it the FORM model:
| Lever | What it measures | What a mobile app can change | Core metrics |
|---|---|---|---|
| Frequency | How often customers buy | Home-screen presence, push reminders, one-tap reorder | Orders per customer per year, days between orders |
| Order value | How much they spend per order | Cart recommendations, bundles, free-shipping progress | AOV, items per order, attach rate |
| Retention | How long they keep buying | Owned reach, visible loyalty, churn alerts, subscriptions | Repeat purchase rate, cohort retention, churn |
| Margin | How much of each order you keep | Less paid retargeting, fewer blanket discounts, return prevention | Contribution margin per customer, discount rate, return rate |
In the formula above, frequency and retention both show up through r. Customers who buy more often are the same customers who keep buying. So when research shows that apps mostly increase purchase frequency, that directly affects lifetime value.
Why Retention Matters So Much For LTV, And The Bain Statistic Most Articles Misquote
You've probably read that "a 5% increase in retention increases profits by 25% to 95%." It's credited to Bain & Company's Frederick Reichheld and repeated in nearly every retention article.
The idea holds up, but the figure gets stretched. Reichheld's own Bain brief, Prescription for cutting costs, says that in financial services a 5% increase in customer retention produces more than a 25% increase in profit. The 95% figure doesn't appear in that brief. His earlier work, including the 1990 Harvard Business Review article Zero Defections: Quality Comes to Services with W. Earl Sasser, looked at service businesses, not DTC ecommerce.
Retention clearly pays. How much it pays depends on your margins, category, and repeat behaviour, so run the numbers for your own store.
Worked example: when retention beats AOV as an LTV lever
Back to the illustrative brand: $60 AOV and a 60% margin, so $36 of gross profit per order.
| Repeat probability (r) | Expected orders, 1 ÷ (1 − r) | Gross-profit LTV at $36 per order |
|---|---|---|
| 30% | 1.43 | $51.43 |
| 35% | 1.54 | $55.38 |
| 45% | 1.82 | $65.45 |
| 50% | 2.00 | $72.00 |
| 55% | 2.22 | $80.00 |
Now compare two moves:
- Raise AOV by 10%. LTV rises by 10%, whatever your retention.
- Raise repeat probability by 5 points. At 30% retention, LTV rises 7.7%. At 50%, it rises 11.1%.
The two cross at 45%. Below that, a 10% AOV lift beats a 5-point retention gain. Above it, retention wins, and each additional point is worth more than the one before.
How to use this: if your repeat rate is low, your quickest LTV gains often come from order value and from getting first-time buyers to order again. If you already have a solid repeat base, put retention first, because every extra point pays more. An app can help with both. Your starting point decides which comes first.
Do Mobile Apps Increase Customer Lifetime Value? What The Research Shows
Most peer-reviewed studies find that customers who adopt and keep using a brand's app buy more often and spend more overall. How much depends on continued use, the category, and how people use the app. In at least one competitive category, adoption reduced spending.
| Study | Setting | What happened | What it means for LTV |
|---|---|---|---|
| Narang & Shankar, Marketing Science (2019) | A large retailer's app launch, difference-in-differences design | Adopters bought 33% more frequently, bought 34% more items, and spent 37% more than non-adopters. They returned 35% more often and 41% more by value. Net, they spent 36% more | Frequency drives the gain. Returns rise too, so measure net |
| Kim, Wang & Malthouse, Journal of Interactive Marketing (2015) | A coalition loyalty program, propensity score matching | Adoption and continued use increased future spending, most for customers using both main features. When customers stopped using the app, spending fell | Ongoing use matters more than installs |
| Wang, Malthouse & Krishnamurthi, Journal of Retailing (2015) | An online grocer | Order rate rose after customers adopted mobile shopping. Low spenders increased both order rate and order size. Mobile was used mostly for habitual, previously bought products | Apps suit replenishment and routine buys better than new or considered products |
| Liu, Lobschat, Verhoef & Zhao, Journal of Interactive Marketing (2019) | Customers who already used the brand's mobile website | App adopters showed higher purchase incidence and spending than non-adopters; the app reduced perceived financial risk | The app adds value even for people already shopping on mobile web |
| van Heerde, Dinner & Neslin, International Journal of Research in Marketing (2019) | 629 users of a retailer's app | Incremental sales were larger among customers far from stores and offline-only customers, whose purchase lift reached 9.5% | The least engaged customers had the most to gain |
| Gu & Kannan, Journal of Marketing Research (2021) | A hotel chain in a highly competitive market | App adoption had a significant negative effect on overall spending, smaller for customers who used the check-in feature than for those who only searched | In deal-driven categories, apps can turn into comparison tools |
| Narang, Shankar & Narayanan, Journal of Marketing Research (2025) | A natural experiment: an omnichannel retailer's app outage | Purchases fell across channels, mostly in stores; shoppers with lower past spend and more recent purchases were hit hardest | App reliability affects revenue well beyond the app |
Vendor data points the same way, with the usual caveats. Tapcart, a Shopify app builder, analyzed 330 million orders and $31.5 billion in revenue and reported an average total revenue lift of 21.13% after brands launched an app, ranging from 9.82% in health and wellness to 23.97% in fashion and apparel. Customers who started on the web and later adopted the app increased per-shopper spend by roughly 36%. This is vendor-reported platform data, not an independent study.
Why mobile apps raise LTV: 5 mechanisms
- Habit and access: A home-screen icon removes the search step. In the grocery study, customers built mobile shopping into their routines for products they already knew, and routine is what drives frequency.
- Owned reach: Push reaches opted-in customers without buying an impression. Airship, a customer engagement vendor, reports that customers opted in to push make 13% more purchases than those who opted out (vendor research based on 2024 data).
- Saved identity: Stored logins, addresses, and payment methods remove friction from every repeat checkout. In Baymard Institute's survey of shoppers who abandoned checkout, 18% left because the site wanted them to create an account and 17% because the checkout was too long or complicated. In an app, customers deal with that once.
- First-party data: Taps, searches, and wishlist adds feed your segmentation and personalization.
- A reason to open the app: Loyalty balances, early access, and app-only drops give customers a reason to tap your icon instead of searching for a competitor.
When a mobile app won't improve LTV: 5 warning signs
Check the fit before you build. These signals point to weaker results:
| Signal | Why it weakens the LTV effect | Evidence |
|---|---|---|
| Customers buy once every few years | Little room for frequency gains; the app gets deleted between purchases | Mobile shopping was strongest for habitual products (Wang et al.) |
| Customers shop mainly on price across brands | The app becomes a deal-hunting tool | Gu & Kannan's hotel study |
| No one owns app programming | A static app gives customers no reason to return | Airship found the top reasons consumers opt out are messages that are too frequent or not relevant |
| The app is unstable | Failures cut purchases across channels | Narang, Shankar & Narayanan |
| Returns are costly, and fit is uncertain | Returns rise with adoption | Narang & Shankar |
If two or more apply to your brand, deal with them first, or start with one narrow use case such as replenishment or loyalty.
The Customer Lifetime Value Mobile App Playbook: 8 Stages From Install To Win-Back
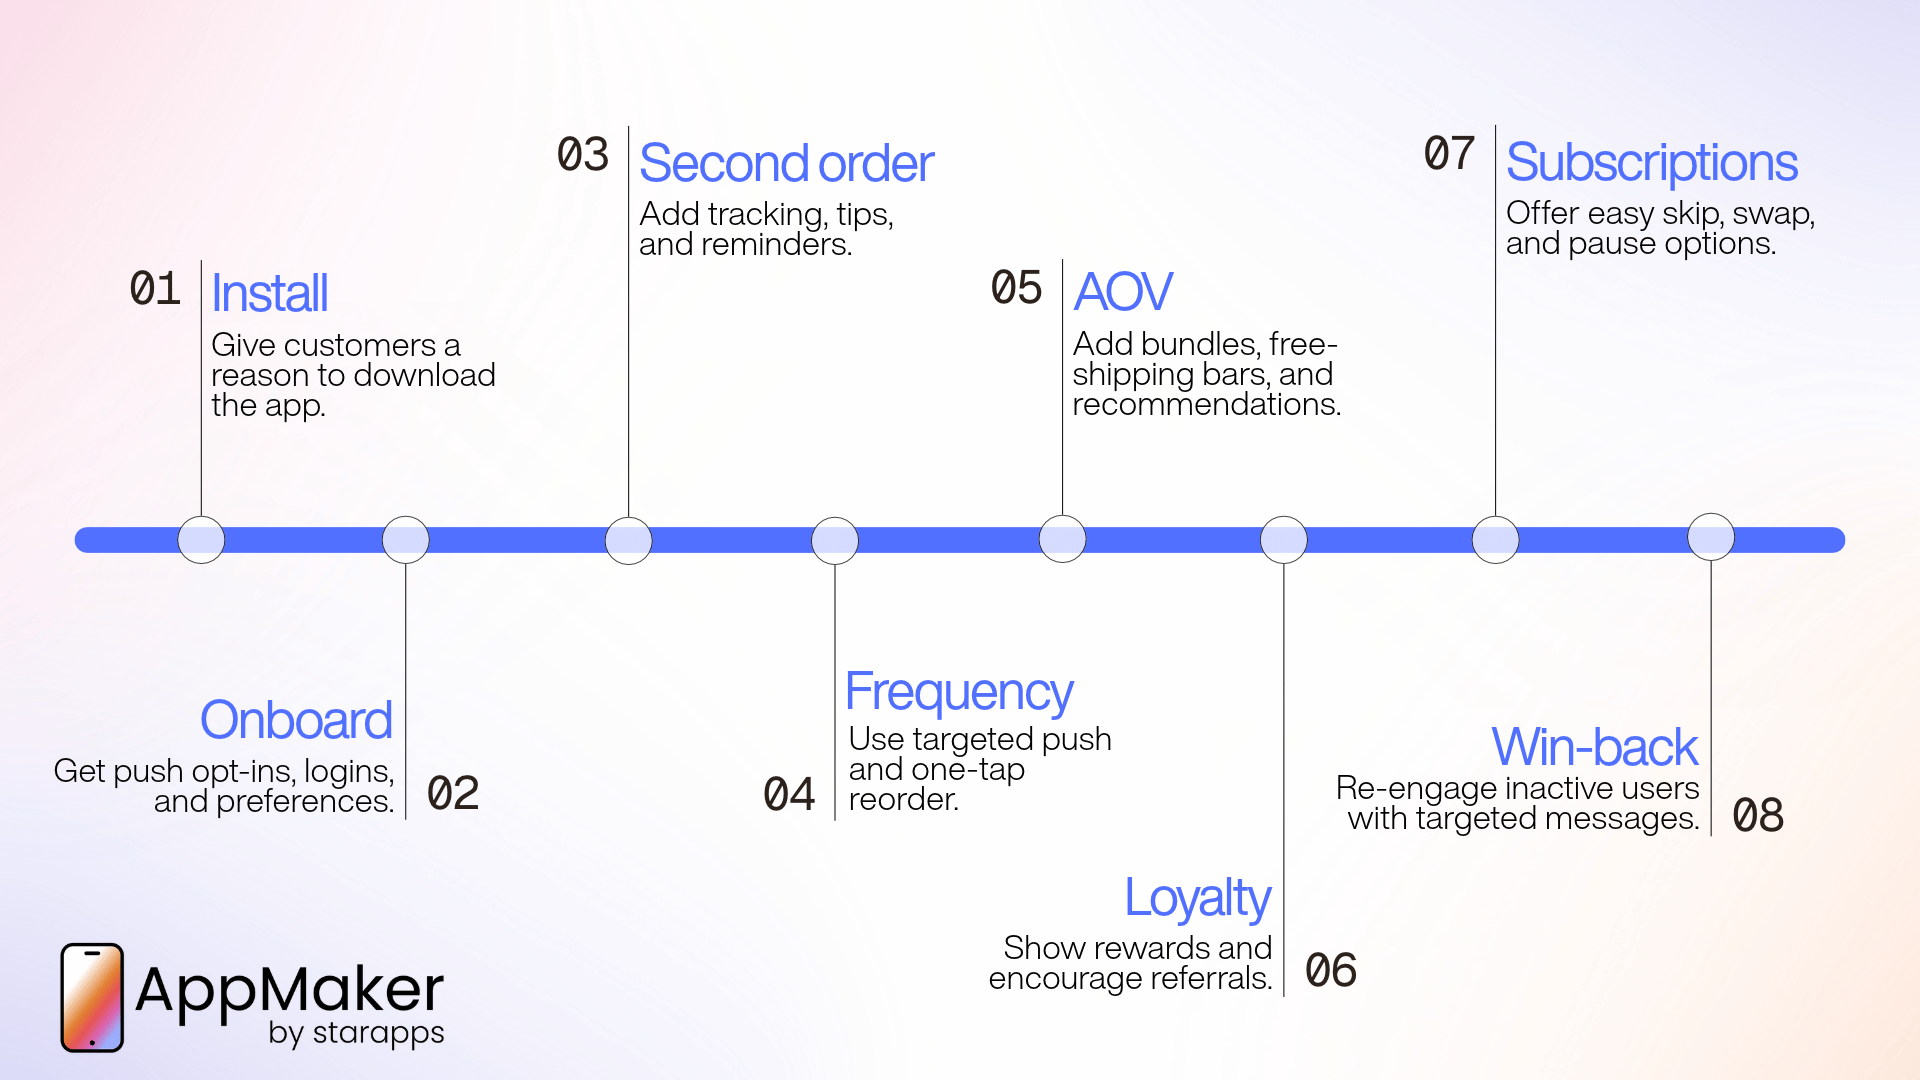
An app does a different job at each point in the customer journey. Here's what each stage needs.
Stage 0: Get repeat customers to download your app
An app can't change the behavior of someone who never installs it, so adoption comes before everything else. Your app adoption rate, the share of active customers using the app each month, puts a ceiling on every result in this guide.
Tapcart's dataset (vendor data) found that roughly 11.2% of customers started their relationship in the app. Everyone else has to be brought in, which is why adoption needs its own plan.
What works:
- Give a concrete reason to install. "Get early access to Thursday's drop" or "See your points and rewards" beats "Download our app."
- Promote the app where repeat intent is highest: order confirmation pages, shipping updates, and post-purchase emails.
- Use native install prompts. On iOS, Smart App Banners show a dismissible banner at the top of Safari. If the app is already installed, the banner opens it instead, and you can pass the current page so the customer lands in the same place in the app.
- Put the app where customers already look: packaging inserts, QR codes, and your loyalty program page.
For more channel ideas, see our guide on how to market a Shopify mobile app.
Metrics: app adoption rate, share of first and repeat orders placed in the app.
Stage 1: Onboard new app users and earn push opt-ins
The first week decides whether you'll be able to reach, recognize, and personalize for this customer later. Skip push permission, login, and preferences now, and every later tactic works with less reach and less data.
1. Ask for push permission in context, not on launch. Apple's developer guidance is to request notification authorization in a context that helps people understand why, not on first launch. Apple also supports provisional authorization, which delivers notifications quietly to Notification Center so people can try them before deciding.
Android changed the rules with Android 13. Apps now need the POST_NOTIFICATIONS runtime permission, notifications are off by default for new installs, and Google recommends waiting until users understand the app before asking. One of Google's own examples of a good moment is right after a user submits an order.
According to Airship's 2026 benchmarks, built on more than 681 billion notifications, Android and iOS opt-in rates have now reached near parity. Android no longer hands you a default audience. You have to earn the opt-in on both platforms.
How to sequence the ask:
- Show a short soft prompt ("Get restock alerts and early access") after a meaningful action, such as the first wishlist add, first order, or loyalty sign-up.
- Trigger the system prompt only when the customer taps yes.
- Ask opted-out users again later with an in-app message tied to a specific benefit. Airship reports that in-app messages lift opt-in among opted-out users by 14% on average and that apps running onboarding campaigns reach opt-in rates up to 40% above their category average (vendor research).
2. Get customers logged in early: A logged-in customer can be recognized, personalized, and measured. Use the lowest-friction login your market supports, such as one-time passcodes, and make the payoff obvious: saved addresses, order tracking, loyalty points.
3. Collect zero-party data: Ask two or three questions that change what the customer sees: size, skin type, pet type, dietary preference. Airship reports a 91% lift in push-attributed purchases when brands used zero-party data in targeting (vendor research). Read that figure with some caution, but the logic is sound: someone who told you their size gets messages that actually fit.
4. Go easy on first-order discounts: Recharge's 2026 Subscription Trend Report found brands increased first-order discounts by 18%. A discount can buy an install, but it eats into margin and teaches customers to wait for the next offer. Lead with non-price value where you can.
Metrics: push opt-in rate, share of app users logged in, profile completion, day-7 app activity, first in-app order rate.
Stage 2: Turn first-time buyers into second-time buyers
A one-time buyer hasn't built a habit yet, which makes the second order the hardest one to win. It's also the order that, in the payback example above, turns an unprofitable customer into a profitable one.
What the app should do after the first order:
- Make the wait useful: Show order tracking in the app. On iOS, Live Activities can show live progress on the Lock Screen and in the Dynamic Island. A Live Activity stays active for up to eight hours, so use it for the out-for-delivery window or same-day orders rather than a multi-day shipment.
- Help the customer get results from the product: How-to content, usage tips, and care guides build confidence and cut returns.
- Ask for a review after delivery, not before.
- Time replenishment reminders to the product: Klaviyo's expected-date-of-next-order prediction needs at least two historical orders, so for first-time buyers, work from consumption windows such as a 30-day supply.
- Suggest a familiar next step: Mobile shoppers lean toward products they already know. Recommend the refill, a complementary item, or a new variant before you push a new category.
Metrics: time to second order, 60- and 90-day repeat rate by first-order channel, share of second orders placed in the app.
Stage 3: Increase purchase frequency with push and one-tap reorder
The most consistent finding across the research is that app users buy more often. Your job here is to make the app the first place customers go when they need what you sell.
Plan push like a content calendar: Who you send to matters more than how much you send. In Airship's data, segmented push lifted push-attributed purchases by 4% to 72%, and as high as 350%. Tailored messages raised open rates by 37% on average, and rich push with images raised direct opens by 22% (all vendor research). Airship's 2026 report adds that send volumes are splitting: the heaviest senders sent more, while Android's median and low-volume apps cut volume by 15% year over year.
Choosing a cadence: if your category gives people natural reasons to check in often, like weekly drops or fresh food, a higher-frequency model can work. If it doesn't, send fewer messages and tie them to behavior: back in stock, a price drop on a wishlisted item, a refill due, points about to expire.
For copy and channel mix, see our guides to writing push notifications that convert and push vs. email vs. SMS.
Make repeat buying a one-tap job:
- A "buy again" rail on the home screen.
- Wishlists that trigger back-in-stock and price-drop alerts.
- Deep links that open each notification on the right product, using Universal Links on iOS and Android App Links.
- Early access in the app first, so opening it becomes the fastest way to get what's new.
Metrics: orders per customer per year, days between orders, monthly active app customers, incremental push-attributed orders, opt-out rate.
Stage 4: Raise AOV with cross-selling and upselling
The aim is to increase what each order is worth without making customers feel pushed.
- Cross-selling suggests a complementary product: the case with the phone, the conditioner with the shampoo.
- Upselling suggests a higher-value version of the same choice: a larger size, a premium tier, a bundle.
Both work better in an app because you know the customer's history and can show suggestions in the cart, where intent is highest.
What works in an app:
- Free-shipping progress bars: Extra costs are the most common reason shoppers abandon checkout, cited by 40% in Baymard's survey. Showing how close someone is to free shipping turns that objection into a reason to add an item.
- Bundles built from your own order data: Package what customers already buy together.
- "Customers also picked" rails on product pages, filtered by the customer's profile.
- Tiered gifts with purchase in the cart, which lift AOV without discounting the core product.
Apps widen what customers buy. In Narang and Shankar's study, app users bought a more diverse set of products, including less popular ones. That helps if you want customers buying across more of your catalog.
AOV can fall while LTV rises. Customers who buy more often may spend less each time. A 2024 study of a fuel retailer's mobile payment app found users transacted more often and spent more in total, but less per transaction. Look at AOV and frequency together for each customer, not channel by channel.
For checkout tactics, see our playbook on reducing abandoned cart rate in a Shopify mobile app.
Metrics: AOV, items per order, attach rate, contribution margin per order.
Stage 5: Make loyalty and referral rewards visible in the app
A loyalty program that customers forget about won't change what they do. An app solves the visibility problem by putting points, tier progress, and rewards on the home screen and in the cart.
Paid vs. free loyalty: McKinsey's 2020 consumer research found members of paid loyalty programs were 60% more likely to spend more with a brand after subscribing, compared with 30% for free programs. The same research found consumers expect at least a 150% return on a paid membership fee. A paid tier makes sense when you can deliver obvious, recurring value, such as free shipping, early access, or member pricing. If you can't yet, start free.
Referred customers are worth more. In a study of nearly 10,000 customers at a German bank, referred customers were at least 16% more valuable over six years and 18% less likely to defect than similar customers who weren't referred. Their margin advantage faded after about 29 months, but the retention advantage held. In an app, sharing a referral code takes one tap from the loyalty screen.
Loyalty tactics that suit an app:
- Show the points balance and "points to next reward" on the home screen and in the cart.
- Send push notifications for milestones: points about to expire, a tier within reach, a reward ready to redeem.
- Recognize your best customers (Shopify's RFM Champions group) with access rather than discounts: early access, exclusive products, priority support.
- Reward actions that predict LTV, such as completing a profile, writing a review, or referring a friend, not just spending.
Where loyalty goes wrong: when points are just delayed discounts. Track discount cost per member next to repeat rate. For more ideas, see our tips on improving customer loyalty with a Shopify mobile app.
Metrics: loyalty enrollment among app users, redemption rate, member vs. non-member repeat rate, referral rate, discount cost per member.
Stage 6: Reduce subscription churn with in-app controls
For replenishable products, subscriptions are the most direct path to frequency. Across 20,000 brands, Recharge reports that subscribers placed nearly 3x more orders than one-time shoppers, subscription checkouts grew 16% relative to one-time purchases, and same-day cancellations fell 35% (vendor research).
Churn is the catch. Recurly's 2026 analysis of 76 million subscribers across more than 2,200 businesses found that 52% of consumers canceled at least one subscription in the past year. Brands that offered "pause before cancel" saw pause usage rise 337%; 3 out of 4 pausers came back within months, and 38% of consumers said they'd rather pause than cancel (vendor research).
Subscription settings often hide in a web portal behind an email link. In the app, they're one tap away. Use that:
- Put skip, swap, reschedule, and pause on the subscription screen, not behind a support ticket.
- Send a push a few days before each shipment ("Your order ships Thursday. Swap or add anything?"). A moment when someone might cancel becomes a chance to add an item.
- Offer pause before cancel, every time.
- Send payment-failure alerts that deep link to the card update screen, so failed payments don't quietly cost you subscribers.
Metrics: subscriber share of active customers, monthly subscriber churn, pause-to-reactivation rate, skip and swap usage, involuntary churn.
Stage 7: Spot churn early and re-engage lapsing customers
Outside subscriptions, churn makes no noise. Customers don't cancel; they just stop buying. A workable definition: a customer has churned when they haven't bought within two to three times their normal purchase interval. Set the multiple from your own data.
Watch leading and lagging signals together:
| Signal | Type | Where to find it |
|---|---|---|
| Shopify RFM "At risk," "Previously loyal" and "Almost lost" groups | Lagging (purchase-based) | Shopify customer reports |
| Churn risk: predicted probability of no purchase in the next 90 days | Predictive | Klaviyo predictive analytics |
| Days since last app open | Leading (behavioral) | Your app analytics |
| Push opt-out or app uninstall | Leading (behavioral) | Your app and push analytics |
The behavioral signals deserve attention because, in the Kim, Wang, and Malthouse study, spending dropped after customers stopped using the app. Customers usually stop opening the app before they stop ordering.
A win-back sequence that protects margin:
- On their next app open: an in-app message with something new for them, such as new arrivals in their category or a restocked wishlist item.
- A personalized push that deep links to a specific product, not the home screen.
- Email or SMS for customers who uninstalled or opted out of push.
- An offer, only if steps 1 to 3 don't work, sized to the customer's predicted value.
- A one-question survey for anyone who still doesn't return, so you find out why.
To find where users drop off inside the app, see our guide to analyzing app stats to find why users drop off.
Metrics: reactivation rate of at-risk customers, win-back revenue net of discounts, share of at-risk customers still opted in to push.
Across every stage: how app experience protects LTV
One bad experience can undo months of good ones. In PwC's Future of Customer Experience survey, 32% of all customers said they would stop doing business with a brand they loved after one bad experience.
In an app, protecting that relationship comes down to a few habits:
- Reliability: The 2025 outage study showed an app failure reduced purchases across channels. Watch crash rates and checkout errors as closely as revenue, because they are revenue.
- Self-service: Order tracking, return requests, and support inside the app cut friction at the moments customers are most frustrated.
- Return prevention: App adopters return more, so invest in size guides, fit notes, and saved size profiles.
- Visible policies: In Baymard's survey, 13% of shoppers who abandoned checkout cited an unsatisfactory returns policy. Make yours easy to find.
How To Use Segmentation And Personalization To Increase LTV
Segmentation decides who gets which message. Personalization decides what each customer sees. Skip both, and your app becomes a faster way to send everyone the same promotion.
Customers notice the difference. McKinsey found 71% of consumers expect companies to deliver personalized interactions and 76% get frustrated when that doesn't happen. The same research found personalization most often drives a 10% to 15% revenue lift, with company-specific results ranging from 5% to 25%.
A mobile app CLV strategy by segment: Shopify RFM groups mapped to app actions
Shopify's RFM analysis scores every customer from 1 to 5 on recency, frequency, and monetary value, then sorts them into 11 groups: Champions, Loyal, Active, New, Promising, Needs attention, At risk, Previously loyal, Almost lost, Dormant, and Prospects. Here's what the app should do for the groups that matter most:
| Segment | The app's job | Example tactic | KPI |
|---|---|---|---|
| New | Get to order two | How-to content, review request, replenishment reminder | Time to second order |
| Promising | Build the habit | Wishlist alerts, complementary product push | 90-day repeat rate |
| Champions and Loyal | Recognize, don't discount | Early access, VIP tier, referral program | Retention, referral rate |
| High predicted spend | Invest ahead of the curve | Personalized new-arrival edits, priority support | Predicted vs. actual CLV |
| Subscribers | Reduce churn, add items | Pre-shipment swap and add push, pause before cancel | Subscriber churn, add-on rate |
| Needs attention and at risk | Win back before they lapse | Personalized deep-link push, then email or SMS | Reactivation rate |
| App dormant (no open in 30+ days) | Restart the habit | "New in your category" push to a specific screen | 30-day app reactivation |
What to personalize first in your app
Start where personalization changes what people buy:
- The home screen, by category affinity or profile. A dog owner should see dog products first.
- Replenishment timing, by product and by the customer's own purchase interval.
- Recommendations, built from purchase history rather than generic bestsellers.
- Push content, based on stated preferences and recent behavior.
- Offers, based on predicted value and price sensitivity, so you don't discount customers who would buy anyway.
A note on privacy: Apple's App Tracking Transparency rules apply when you link your app's data with other companies' data for advertising or share it with data brokers. Using your own first-party data to personalize your own app doesn't count as tracking on its own. Be clear about what you collect, and only ask for data you'll actually use to improve the customer's experience.
How To Measure The LTV Impact Of Your Mobile App
Measure at the customer level, with matched cohorts, over at least six months, and net of returns and margin. Cut any of those corners, and you'll overstate the effect.
Why app users look better than they are: selection bias
Your best customers are the most likely to download your app. Compare app users with everyone else, and you'll see a big gap, most of which was there before the app existed. That's why the studies above used propensity score matching and difference-in-differences designs.
How to measure app LTV in 6 steps
- Build matched cohorts: Pair each app adopter with a similar non-adopter on pre-adoption spend, order count, tenure, and category.
- Compare before and after: Track per-customer spend and order frequency for six to twelve months on each side of adoption.
- Net out returns: Narang and Shankar found returns rose along with purchases, so gross revenue lift isn't the same as profit lift.
- Use margin, not revenue: Subtract discounts, product cost, and fulfillment.
- Hold out automated push: Keep a small random group out of each major flow to see which orders the flow actually created.
- Split by first channel: Separate customers whose first order was in the app from those who started on web.
Shopify's customer cohort analysis report groups customers by first purchase date and tracks their repeat buying. It's a useful baseline before you build app-specific cohorts.
Is your app paying for itself? A simple break-even formula
An app pays for itself when the incremental gross profit it creates is bigger than its total cost. A quick check:
Break-even incremental orders per month = total monthly app cost ÷ gross profit per order
At the illustrative $36 gross profit per order, an app costing $1,000 a month all-in needs about 28 incremental orders a month to break even. Count everything in that cost: platform fees, any share of in-app revenue your platform charges, developer account fees, and the team time spent running the app.
Incremental is the important word. Count only the orders your matched cohorts and holdout groups show wouldn't have happened anyway.
The app LTV scorecard: 8 metrics to track
| Metric | What it tells you | Direction you want |
|---|---|---|
| App adoption rate | How many customers the app can reach | Up |
| Push opt-in rate | Size of your owned audience | Up |
| Time to second order | How fast habits form | Down |
| Orders per customer per year (app vs. matched non-app) | Frequency effect | Up |
| AOV and items per order | Order value effect | Stable or up |
| Return rate (app vs. matched non-app) | Hidden cost of extra purchases | Stable |
| 90-, 180-, and 365-day gross-profit LTV by cohort | The outcome | Up |
| At-risk reactivation rate | How well you win customers back | Up |
A 90-Day Plan To Raise Customer LTV With Your App
| Phase | Focus | Actions | What to report |
|---|---|---|---|
| Days 1 to 30 | Adoption and onboarding | Add value-led install prompts; move the push prompt after a meaningful action; add login benefits and profile questions; set up matched-cohort reporting | Adoption rate, opt-in rate, logged-in rate, baseline LTV by cohort |
| Days 31 to 60 | Second purchase and frequency | Launch post-purchase journeys, replenishment reminders, wishlist and back-in-stock alerts and a reorder rail; add holdouts to automated flows | Time to second order, incremental push orders |
| Days 61 to 90 | Order value and retention | Add cart recommendations and free-shipping progress; surface loyalty and referrals; launch an at-risk win-back flow; add pause before cancel | AOV alongside frequency, reactivation rate, subscriber churn |
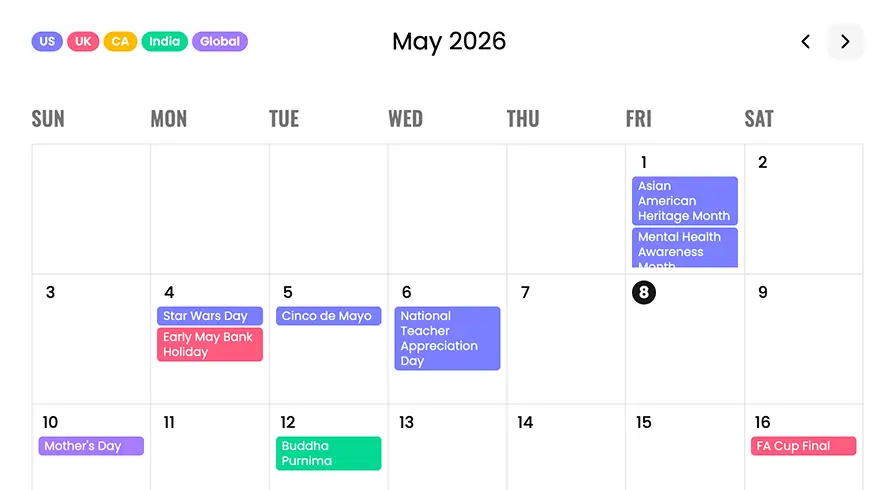
Plan campaigns around your category's busiest buying moments; AppMaker's marketing calendar is a handy starting point. For more retention ideas, see 8 mobile app retention strategies, and for the wider mobile funnel, our mobile commerce optimization guide.
Where AppMaker Fits In A Mobile App LTV Strategy
AppMaker is a Shopify mobile app builder for native iOS and Android apps. In an LTV program, it gives your team the tools to run the playbook above without a development cycle for every change. Here's how its published features line up with the FORM model:
| LTV lever | What the playbook needs | Relevant AppMaker capability |
|---|---|---|
| Frequency and retention | Scheduled and behavior-triggered push with segment targeting | Push notifications with scheduled campaigns, automated triggers for abandoned carts, restocks and inactivity, and targeting by behavior, preferences and location; |
| Personalization | Different experiences for different customers | App Conditional Blocks can show offers only to returning users, tailor onboarding flows by category and trigger offers for inactive users |
| Order value | Reorder rails, bundles, free-shipping progress | Extensions including a Reorder Product Scroller, Product Bundles and a Cart Progress Bar |
| Loyalty and subscriptions | Loyalty, subscription and review tools inside the app | Integrations with third-party loyalty, subscription and review apps |
| Measurement | Retention, frequency and AOV by segment | Analytics covering revenue per session, conversion rate, AOV, retention and purchase frequency, with user segmentation |
What AppMaker customers report (vendor data, self-reported and not independently audited):
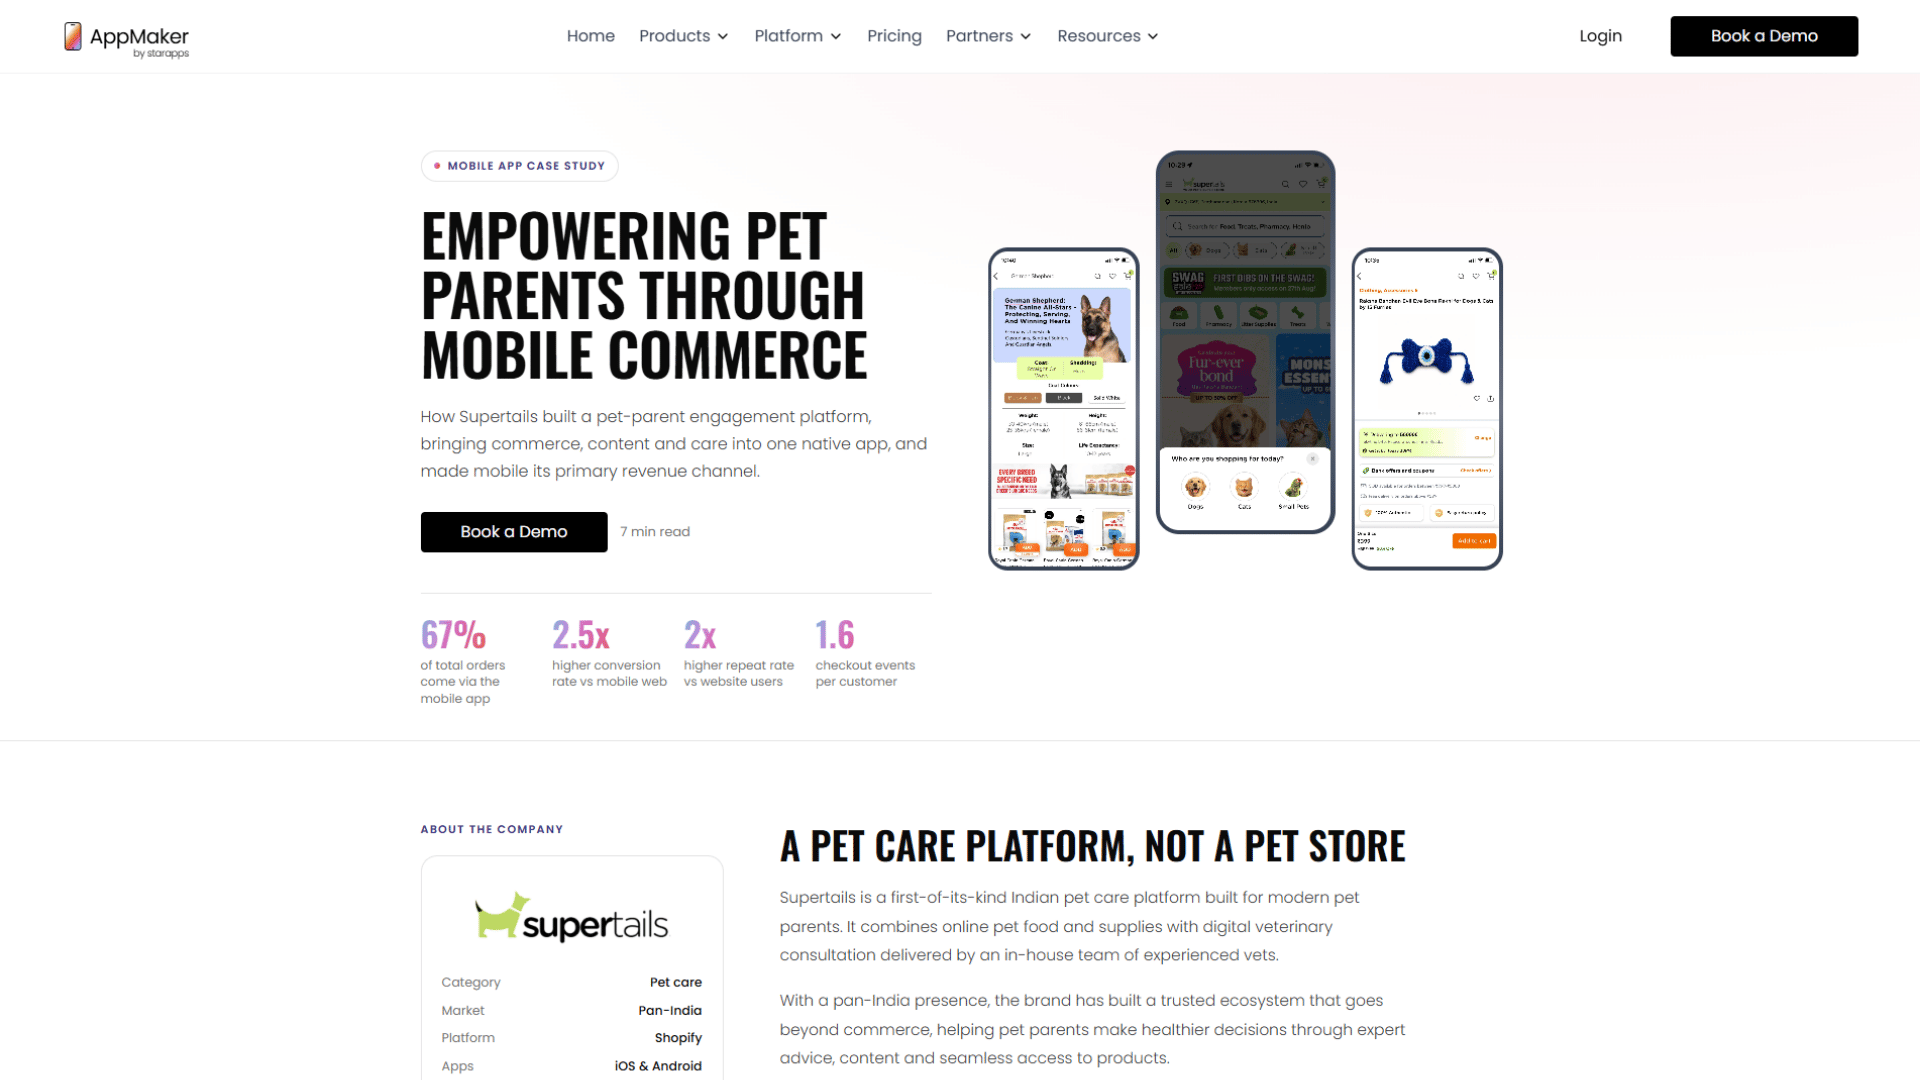
- Supertails, an Indian pet care brand, reports that 67% of its total orders come through its app and that app users have a 2x higher repeat rate than website users. Its onboarding asks for each customer's pet type and age, and the home screen, content, and recommendations change by pet profile. It's a clear example of the onboarding and segmentation stages working together.
- XYXX, a premium innerwear brand, reports a repeat customer rate consistently above 30%, up to 60-plus push campaigns a month, and a coins-based loyalty program that rewards orders, reviews, and referrals.
Both brands sell in repeat-purchase categories, which is where the independent research predicts the strongest effects. A brand selling infrequent, high-consideration products should expect smaller gains.
What an app can't do: it won't fix a product customers don't want to rebuy, unit economics that only work with deep discounts, or a channel nobody has time to run. To see more categories, browse the case study library or the 2026 India Mobile App Report. If you're still comparing platforms, our guide to Shopify mobile app builders covers the main options, and AppMaker's pricing is public so you can run the break-even math above.
Conclusion: What To Do First To Raise Customer LTV With Your App
Every study in this guide points to the same condition. Apps raise lifetime value when customers keep using them, and stop raising it when they don't. Each stage of the playbook exists to give customers a reason to open the app again.
Where you start depends on where you are today:
- No app yet: run the fit check and the break-even formula before you build anything.
- App live, but few customers use it: fix adoption and onboarding first. Push, loyalty, and personalization can't reach people who aren't in the app.
- Good adoption, weak repeat buying: below the 45% crossover in our worked example, the second order and AOV usually pay off faster than chasing retention points.
- Strong repeat base: put retention first with visible loyalty, flexible subscriptions, and early churn alerts.
- No idea what's working: set up matched cohorts and holdouts before adding another tactic.
Pick one, give it 90 days, and judge it on incremental gross profit rather than downloads or opens. If the numbers beat the app's full cost, scale what worked. If they don't, the FORM model will show you which lever to fix next.
Frequently Asked Questions
What is a customer lifetime value mobile app strategy?
It's a plan for using a branded app to raise the profit each customer brings in over time. The app increases purchase frequency through home-screen access and push, lifts order value with in-cart recommendations, keeps customers longer through loyalty and subscriptions, and supplies first-party data for personalization. You judge it by gross-profit LTV, not downloads.
How does a mobile app increase customer lifetime value?
Mostly by getting customers to buy more often. Peer-reviewed retail studies find that customers who adopt a brand's app and keep using it make more purchases and spend more overall than comparable non-adopters. The main drivers are easy access, owned push reach, saved login and payment details, and personalization.
What is a good customer lifetime value for a Shopify store?
There's no universal number, because LTV depends on margin, category, and acquisition cost. A better test is whether gross-profit LTV comfortably exceeds what you pay to acquire a customer, and how quickly you earn that cost back. Track your own cohorts over time instead of chasing an industry average.
How can I increase LTV on Shopify without relying on discounts?
Focus on the second purchase, replenishment timing, free-shipping thresholds, bundles, and visible loyalty rewards such as early access. Use Shopify's RFM groups and predicted spend tier to save offers for customers who need a reason to return, and reward your best customers with access instead of price cuts.
Do mobile apps increase repeat purchases?
Usually, as long as customers keep using the app. Studies of a large retailer, an online grocer, and a coalition loyalty program all found that app adopters bought more often or spent more afterward. The effect fades when customers stop opening the app, so it needs a steady reason to come back.
Are push notifications better than email for retention?
They do different jobs. Push reaches opted-in app users instantly and suits timely, personal triggers like restocks or refill reminders. Email carries richer content and reaches customers who don't have the app. The best programs use both together. Our channel comparison covers the trade-offs.
How long does it take for an app to change LTV?
Give it six to twelve months. Early numbers mislead because your most loyal customers download first, and habits take several purchase cycles to form.
Is a mobile app worth it for customer lifetime value?
It is when the incremental gross profit it creates exceeds its full cost. Divide your total monthly app cost by gross profit per order to get the incremental orders you need each month, then check your matched cohorts against that number. Repeat-purchase brands clear that bar far more easily than once-a-year categories.
Should I offer app-exclusive discounts?
Sparingly. Exclusive access, such as early drops, member pricing, and restock alerts, builds the habit of opening the app without training customers to wait for deals. If you do discount, size the offer to the customer's predicted value and track discount cost per customer.
How do I compare LTV for app users and website users fairly?
Use matched cohorts. Pair app adopters with similar non-adopters on pre-adoption spend, order history, and tenure, then compare per-customer gross profit net of returns over the same period. A raw app-versus-web comparison overstates the effect because heavy buyers adopt apps first.
Which DTC brands benefit most from a mobile app?
Brands with replenishable or frequently bought products, regular newness such as drops or seasonal collections, and a solid base of repeat customers. Pet care, beauty, food, apparel, and personal care usually fit. Brands selling once-a-decade purchases usually don't.
Can a mobile app hurt customer lifetime value?
Yes. Spending can slip when customers stop using an app; unstable apps reduce purchases across channels, and in price-driven categories, apps can encourage deal comparison. Returns also tend to rise. Running the app well, keeping it reliable and measuring it honestly, matters as much as the launch.