


Stop guessing and pinpoint the exact moments when users abandon your app and start losing revenue. Most analytics dashboards list metrics, but rarely explain which specific user actions trigger consistent drop-offs. Understanding behavioral patterns helps connect engagement signals directly to retention, conversion, and long-term growth.
Teams constantly refine their apps to improve engagement, retention, and overall user experience across different touchpoints. Over 95% of Google Play apps and 97% of App Store apps update annually. This frequency reflects how often changes are made, making it essential to analyze app stats to measure real impact.
In this article, you will learn how to analyze app stats to uncover where and why users drop off. Clear frameworks, supported by the right tools, will help turn raw data into actionable fixes that improve retention, engagement, and conversions.
What Does it Mean to Analyze App Stats?
Analyzing app stats means examining user behavior data to understand how people interact with your app across key journeys. It involves connecting metrics like retention, session flow, and conversions to identify where users lose interest or face friction.
Clear analysis helps turn raw numbers into decisions that improve engagement, reduce drop-offs, and increase revenue from existing users.
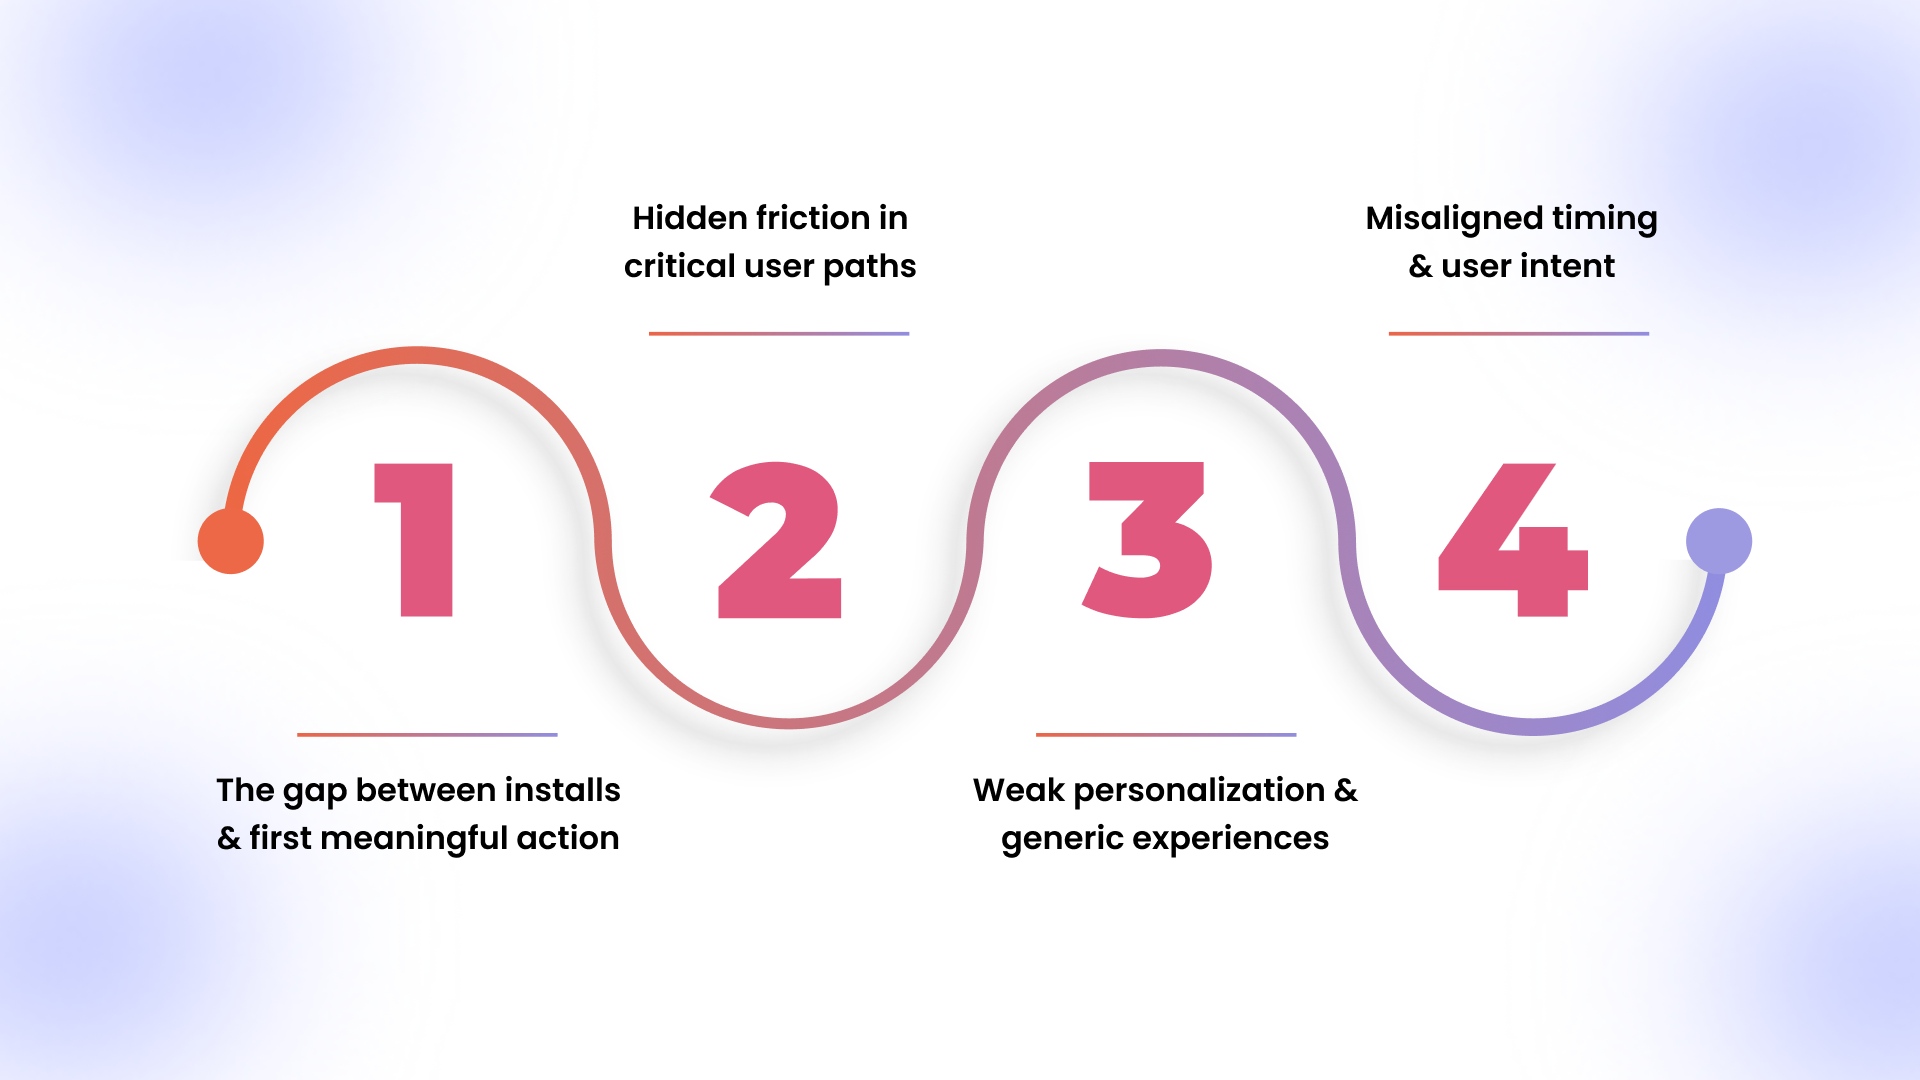
Why Users Drop Off Even When Your App Looks “Fine”?
Even well-designed apps lose users when subtle friction, unmet expectations, or poor timing disrupt key user journeys.
A closer look at user behavior reveals where these drop-offs actually begin and how they build over time.
1. The gap between installs and first meaningful action
- High install numbers often mask weak onboarding that fails to guide users toward a clear first action.
- Drop-offs occur when users cannot quickly understand the value within the first few screens or interactions.
- Delays in loading personalized content reduce initial engagement and increase early session exits.
2. Hidden friction in critical user paths
- Multi-step navigation between product discovery and checkout increases cognitive load and causes user hesitation.
- Slow-loading product pages or unresponsive elements break momentum during high-intent browsing sessions.
- Inconsistent UI elements across screens confuse users, especially when actions behave differently in similar contexts.
3. Weak personalization and generic experiences
- Static home screens fail to reflect user preferences, reducing relevance and repeat session motivation.
- Lack of behavior-based recommendations limits product discovery and lowers overall session depth.
- Irrelevant content exposure leads to faster exits, especially for returning users expecting tailored experiences.
4. Misaligned timing and user intent
- Push notifications sent without behavioral triggers interrupt rather than re-engage users meaningfully.
- Promotions shown too early or too late in the journey fail to convert high-intent users effectively.
- Lack of contextual triggers prevents users from taking action when they are most likely to convert.
Once the reasons behind drop-offs become visible, the next step is knowing which data points actually reveal those patterns.
Key App Stats That Reveal Real Drop-Off Causes
Focusing on the right metrics helps uncover where users disengage and what those signals actually indicate.
Breaking down these metrics makes it easier to connect numbers with real user behavior and decisions.
1. Retention rate across key timeframes
- Tracks how many users return after their first session
- Day 1 drops signal weak onboarding or unclear value delivery
- Day 7 declines indicate a lack of habit formation or engagement triggers
- Day 30 gaps reflect poor long-term value or limited repeat incentives
2. Session duration and frequency patterns
- Measures how long and how often users interact with the app
- Short sessions with high exits suggest friction in navigation or slow load speeds
- Low session frequency indicates weak re-engagement strategies or poor recall value
- Sudden drops in session time often point to broken flows or irrelevant content exposure
3. Funnel drop-off rates across journeys
- Identifies where users exit during key conversion paths
- Product view to cart drop-offs indicate pricing concerns or a lack of trust signals
- Cart to checkout exits often reveal hidden costs or complex processes
- Payment-stage abandonment signals friction in final decision-making
4. Screen flow and navigation paths
- Shows how users move across screens and where they stop
- Repeated back-and-forth navigation indicates confusion or unclear next steps
- Sudden exits from specific screens highlight usability or performance issues
- Dead-end paths suggest missing links or incomplete user journeys
5. Conversion rate aligned with user intent
- Evaluates how effectively sessions turn into meaningful actions
- High traffic with low conversions signals a mismatch between expectations and experience
- Strong engagement but low purchase points to friction in the decision or checkout stages
- Variations across segments reveal gaps in personalization or targeting strategies
Metrics alone do not solve anything unless they are analyzed in the right sequence to uncover where users actually drop off.
How to Analyze App Stats to Find Drop-Off Points in 2026?
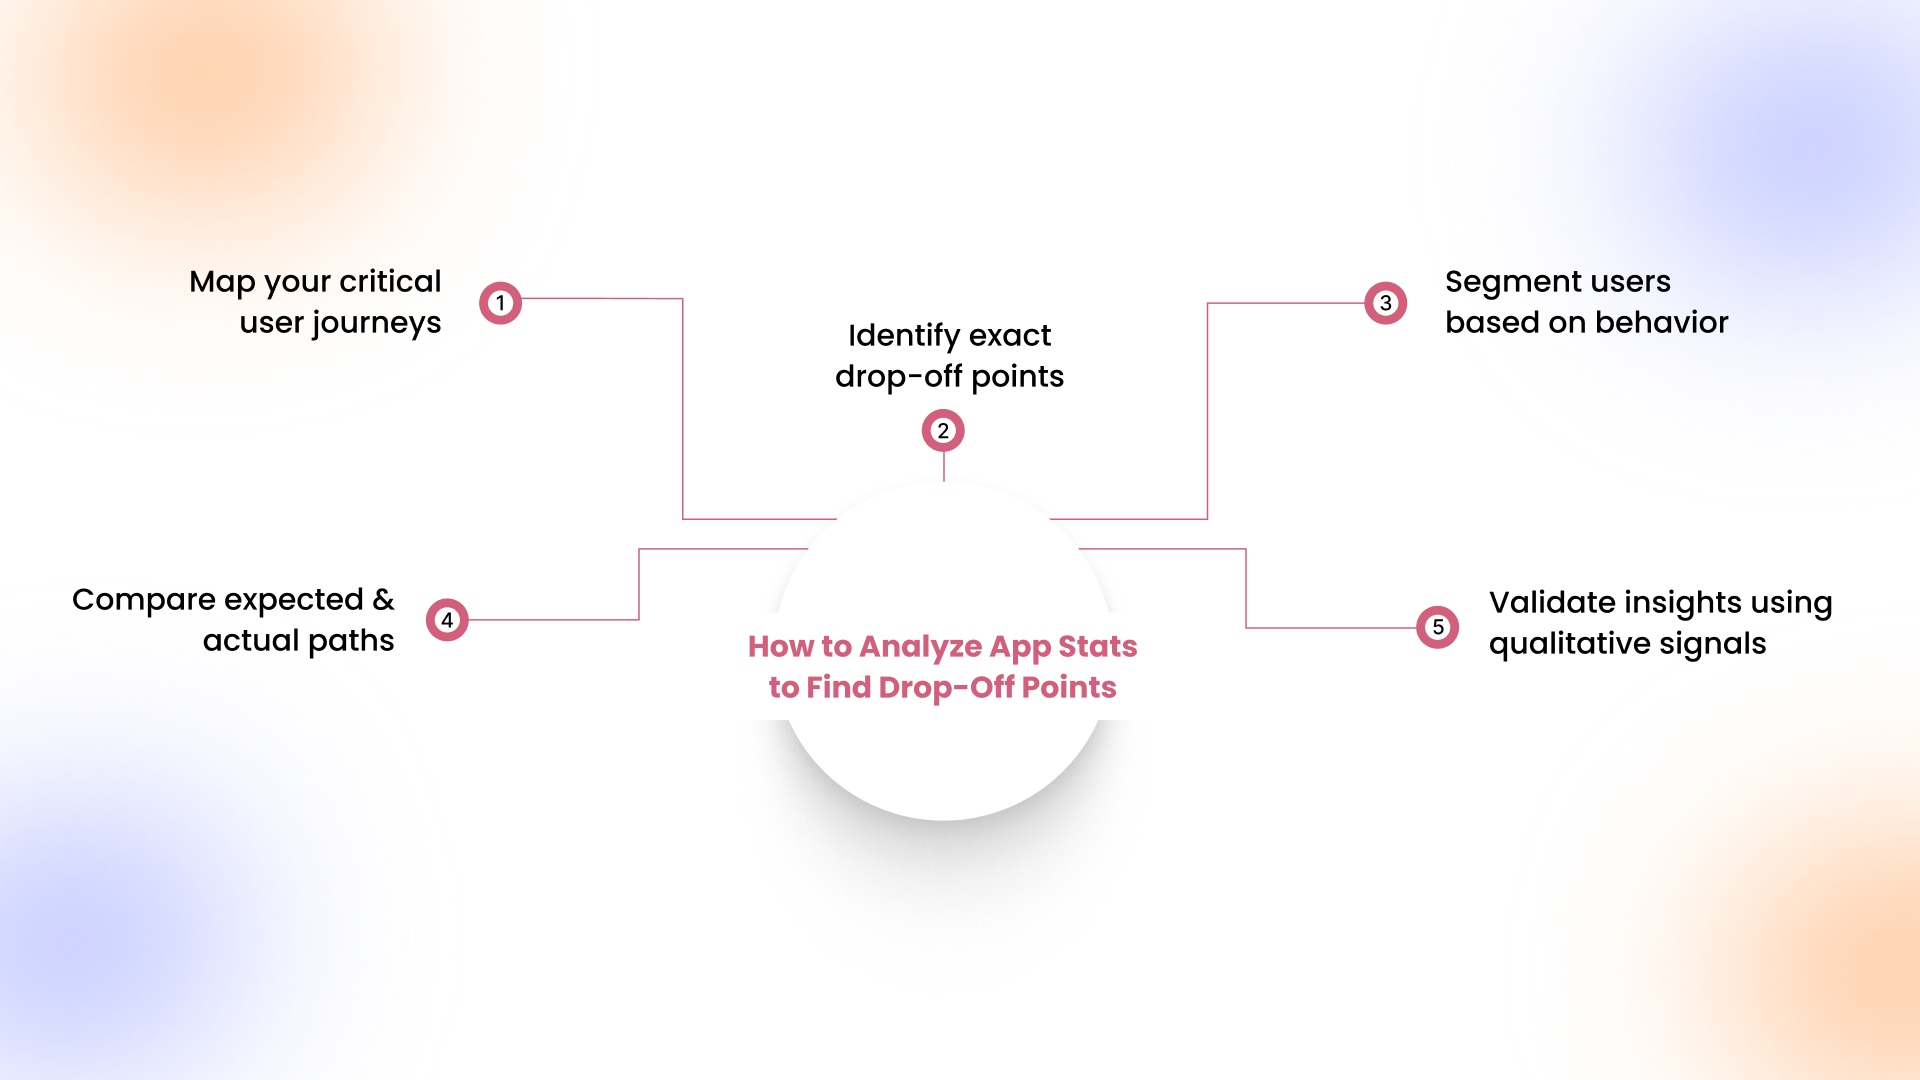
A structured process helps connect scattered metrics into clear insights that explain where and why users disengage.
Here is a practical framework to analyze app stats and identify exact drop-off points across user journeys.
Step 1: Map your critical user journeys
Clear journey mapping reveals how users are expected to move through your app and where value is delivered.
Here are the key journeys you should define before analyzing user behavior patterns.
- Identify primary journeys such as homepage to product page to cart and final checkout completion
- Include secondary paths like search usage, category browsing, and re-engagement through notifications or campaigns
- Focus on journeys that directly impact revenue, retention, or repeat purchase behavior across sessions
- Remove redundant steps that slow navigation and reduce clarity in high-intent user flows
Step 2: Identify exact drop-off points
Pinpointing drop-off stages helps isolate where users lose interest or encounter friction within critical flows.
Here are the key ways to locate and measure user exits within your app journeys.
- Use funnel analysis to measure progression between each stage within a defined user journey
- Identify sharp percentage drops between steps that signal friction or hesitation during decision-making
- Compare entry and exit points across sessions to detect patterns in user abandonment behavior
- Highlight screens with the highest exit rates and analyze their role within the overall journey
Step 3: Segment users based on behavior
User segmentation uncovers hidden patterns by showing how different groups experience your app differently.
Here are the key segments to analyze for deeper insights into engagement and drop-off behavior.
- Separate new users from returning users to compare onboarding effectiveness and repeat engagement patterns
- Identify high-value users based on purchase frequency, session depth, and overall contribution to revenue
- Analyze behavior across acquisition channels to understand which sources drive low or high engagement users
- Compare performance across devices, locations, or demographics to identify segment-specific friction points
Step 4: Compare expected behavior with actual paths
Behavior comparison highlights mismatches between intended flows and real usage, exposing usability gaps affecting conversions.
Here are the key comparisons to make between expected journeys and actual user navigation paths.
- Define expected actions users should take at each step based on app design and business goals
- Use screen flow analysis to compare actual navigation paths against planned user journeys
- Identify skipped steps or unusual navigation patterns that indicate confusion or unclear guidance
- Detect repeated loops or backtracking behavior that signals friction within specific screens or actions
Step 5: Validate insights using qualitative signals
Validation strengthens data findings by confirming patterns through real user feedback and contextual signals.
Here are the key sources to use for validating insights before making product or design changes.
- Review app store reviews and ratings to identify recurring complaints related to usability or performance
- Analyze customer support queries that highlight friction points in navigation, checkout, or engagement flows
- Use session recordings or heatmaps to visually confirm where users struggle or abandon actions
- Cross-reference findings with campaign data to understand how messaging influences user behavior and retention
Clear analysis highlights where users leave, but acting on those insights becomes easier when the right tools help surface patterns faster and reduce manual effort.
15 Best Tools to Analyze App Stats in 2026
Choosing the right tools helps track user behavior, identify drop-off points, and understand how users interact across app journeys.
Here are some of the most widely used tools to analyze app stats and improve retention.
1. John AI, Appmaker
- Core capability: Gives Shopify brands an AI assistant inside Appmaker that handles analytics, campaigns, and optimization from one dashboard.
- Key features: Instantly answers business questions, analyzes store performance, plans and sends campaigns, surfaces actionable insights, automates recovery flows like abandoned cart campaigns, and supports revenue forecasting inside the dashboard.
- Pricing: Growth plan starts at $599 per month plus 2% of in-app sales, Essential at $999 per month plus 1%, with Enterprise pricing customized.
- Best for: Brands that want to turn app insights into live improvements faster, with less dependence on separate reporting and development workflows.
2. Firebase Analytics
- Core capability: Tracks user behavior using event-based analytics across mobile apps, helping monitor sessions, retention, and in-app actions.
- Key features: Includes funnel tracking, A/B testing, crash reporting, performance monitoring, and deep integration with Google Cloud services.
- Pricing: Offers a no-cost Spark plan with usage limits and no payment method, while the Blaze plan follows pay-as-you-go pricing with $300 free credit and charges based on usage.
- Best for: Teams that want a scalable, no-cost analytics setup with strong integration across Android, iOS, and Google infrastructure.
3. Mixpanel
- Core capability: Analyzes user journeys through event-based tracking, helping identify drop-off points and conversion behavior across app interactions.
- Key features: Provides funnels, retention analysis, behavioral cohorts, session replays, multi-touch attribution, and anomaly detection.
- Pricing: Includes a free plan with up to 1M events per month and 10K session replays, while paid plans start at $0 and scale based on usage, with enterprise custom pricing available.
- Best for: Product and growth teams that need detailed visibility into user behavior, conversion funnels, and engagement patterns.
4. Amplitude
- Core capability: Tracks product usage and user behavior to analyze retention, engagement, and feature-level interactions within mobile apps.
- Key features: Includes cohort analysis, session replay, experimentation tools, predictive insights, and behavioral segmentation.
- Pricing: Offers a free starter plan with up to 10K monthly tracked users, while paid plans start around $49 per month with custom enterprise pricing.
- Best for: Businesses that require deeper behavioral analytics and long-term insights into user engagement and retention trends.
5. AppsFlyer
- Core capability: Measures user acquisition and attribution while connecting marketing performance with in-app user behavior and engagement.
- Key features: Includes attribution tracking, deep linking, fraud detection, ROI measurement, and cross-channel analytics.
- Pricing: Offers a Zero plan for basic usage, a Growth plan with pay-as-you-go pricing at around $0.07 per conversion, and custom enterprise pricing.
- Best for: Marketing teams that need to track campaign performance and connect acquisition data with user engagement outcomes.
6. CleverTap
- Core capability: Tracks user engagement and lifecycle behavior while analyzing how users interact with campaigns and app experiences.
- Key features: Provides segmentation, behavioral analytics, push notification tracking, and AI-driven engagement insights.
- Pricing: Starts at approximately $64 per month, with pricing based on monthly active users and additional customization needs.
- Best for: eCommerce and D2C brands focused on improving retention through personalized engagement and lifecycle campaigns.
7. UXCam
- Core capability: Tracks user behavior through session recordings and journey analytics, helping identify where users drop off within mobile app flows.
- Key features: Includes session replay, heatmaps, funnel analytics, user journey tracking, and AI-powered insights through Tara AI for faster issue detection.
- Pricing: Offers a limited free plan with up to 3,000 monthly sessions, while Starter and Growth plans are usage-based, with custom pricing for higher volumes and enterprise needs.
- Best for: Product teams and eCommerce apps that need visual insights into user behavior and want to identify friction points in real user journeys.
8. FullStory
- Core capability: Captures complete user interactions to analyze behavior, detect friction, and understand how users move through digital experiences.
- Key features: Provides session replay, journey mapping, heatmaps, funnels, AI-driven insights through StoryAI, and behavioral data analysis across user interactions.
- Pricing: Does not publicly list fixed pricing, offering custom plans based on usage, scale, and feature requirements.
- Best for: Teams focused on deep behavioral analytics and understanding user experience issues across web and mobile platforms.
9. Heap Analytics
- Core capability: Automatically captures all user interactions across your app, allowing analysis of user journeys without manual event tracking.
- Key features: Includes autocapture, funnel analysis, session replay, and AI-driven insights to identify friction and conversion opportunities.
- Pricing: Offers a free plan with up to 10,000 monthly sessions, with Growth, Pro, and Premier plans using custom session-based pricing.
- Best for: Teams that want a quick setup without engineering effort and need complete visibility into user behavior across the entire journey.
10. Adjust
- Core capability: Tracks attribution and marketing performance while analyzing how acquisition channels impact user behavior inside the app.
- Key features: Includes attribution tracking, ROI measurement, fraud prevention, deep linking, and AI-driven insights through Growth Copilot.
- Pricing: Offers a free Base plan with up to 1,500 monthly attributions, while Core and Enterprise plans scale based on attribution volume and usage.
- Best for: Marketing teams that need to connect campaign performance with user engagement and optimize acquisition strategies.
11. Branch
- Core capability: Measures user journeys across channels using deep linking and attribution, helping analyze how users move from acquisition to in-app actions.
- Key features: Includes deep linking, cross-platform attribution, AI-driven insights through Ivy, and journey tracking across web, email, and app touchpoints.
- Pricing: Does not publicly list fixed pricing, offering custom plans based on usage, scale, and business requirements.
- Best for: Growth and marketing teams that need to understand cross-channel journeys and improve conversion paths into the app.
12. Kissmetrics
- Core capability: Tracks individual user behavior across sessions, helping analyze conversion funnels, retention, and revenue-driven actions.
- Key features: Includes funnel reports, cohort analysis, revenue tracking, behavioral segmentation, and campaign automation based on user actions.
- Pricing: Starts at $99 per month for up to 500,000 events, with pricing scaling based on event volume and usage requirements.
- Best for: eCommerce and SaaS businesses that want to connect user behavior directly to revenue and conversion performance.
13. Countly
- Core capability: Provides product analytics with a focus on first-party data, helping track user behavior across devices while maintaining full data control.
- Key features: Includes dashboards, funnel analysis, cohorts, push notifications, A/B testing, and AI-assisted analytics for deeper insights.
- Pricing: Offers a free self-hosted plan, a Flex plan starting at $40 per month, and enterprise pricing based on customization and hosting needs.
- Best for: Businesses that prioritize data privacy and need full control over analytics through self-hosted or private cloud environments.
14. MoEngage
- Core capability: Combines customer analytics with cross-channel engagement to analyze app stats and act on user behavior in real time.
- Key features: Includes AI-driven insights, predictive segmentation, journey orchestration, and personalization across push, email, SMS, and in-app messaging.
- Pricing: Custom pricing based on business size, data volume, and engagement requirements, typically tailored for mid-sized and enterprise brands.
- Best for: Retail and consumer brands that want to connect behavioral insights with personalized engagement and lifecycle marketing.
15. Localytics
- Core capability: Tracks user behavior and campaign performance while helping teams analyze app stats tied to engagement and retention.
- Key features: Includes audience segmentation, in-app messaging, push campaigns, and analytics to identify drop-offs and improve user journeys.
- Pricing: No publicly available pricing, with enterprise-focused plans customized based on usage and business requirements.
- Best for: Marketing and product teams that want to combine analytics with messaging to improve retention and customer experience.
Tools help uncover patterns and speed up analysis, but measuring drop-offs accurately still depends on how clearly each stage is quantified within your app journeys.
How to Calculate App Drop-Off Rate?
Drop-off rate measures the percentage of users who exit at a specific step, helping quantify the scale of loss.
Here is the standard formula used to calculate drop-off rate across any stage in your app funnel.
- Drop-off Rate = (Users who entered step – Users who completed step) ÷ Users who entered step × 100
This formula converts user movement into a clear percentage, making it easier to compare performance across stages.
- Example: 1,000 users reached the checkout page, but only 300 completed the purchase successfully
- Result: 700 users dropped off, resulting in a 70% drop-off rate at the checkout stage
Tracking this across different steps highlights which parts of the journey contribute most to overall user loss.
When these rates are mapped across the journey, certain drop-off patterns begin to stand out clearly.
Common App Drop-Off Patterns You Should Not Ignore
Recognizing repeated drop-off patterns helps connect user behavior with specific friction points that impact engagement and revenue.
Here are the most common scenarios where users disengage and what the data is actually indicating.
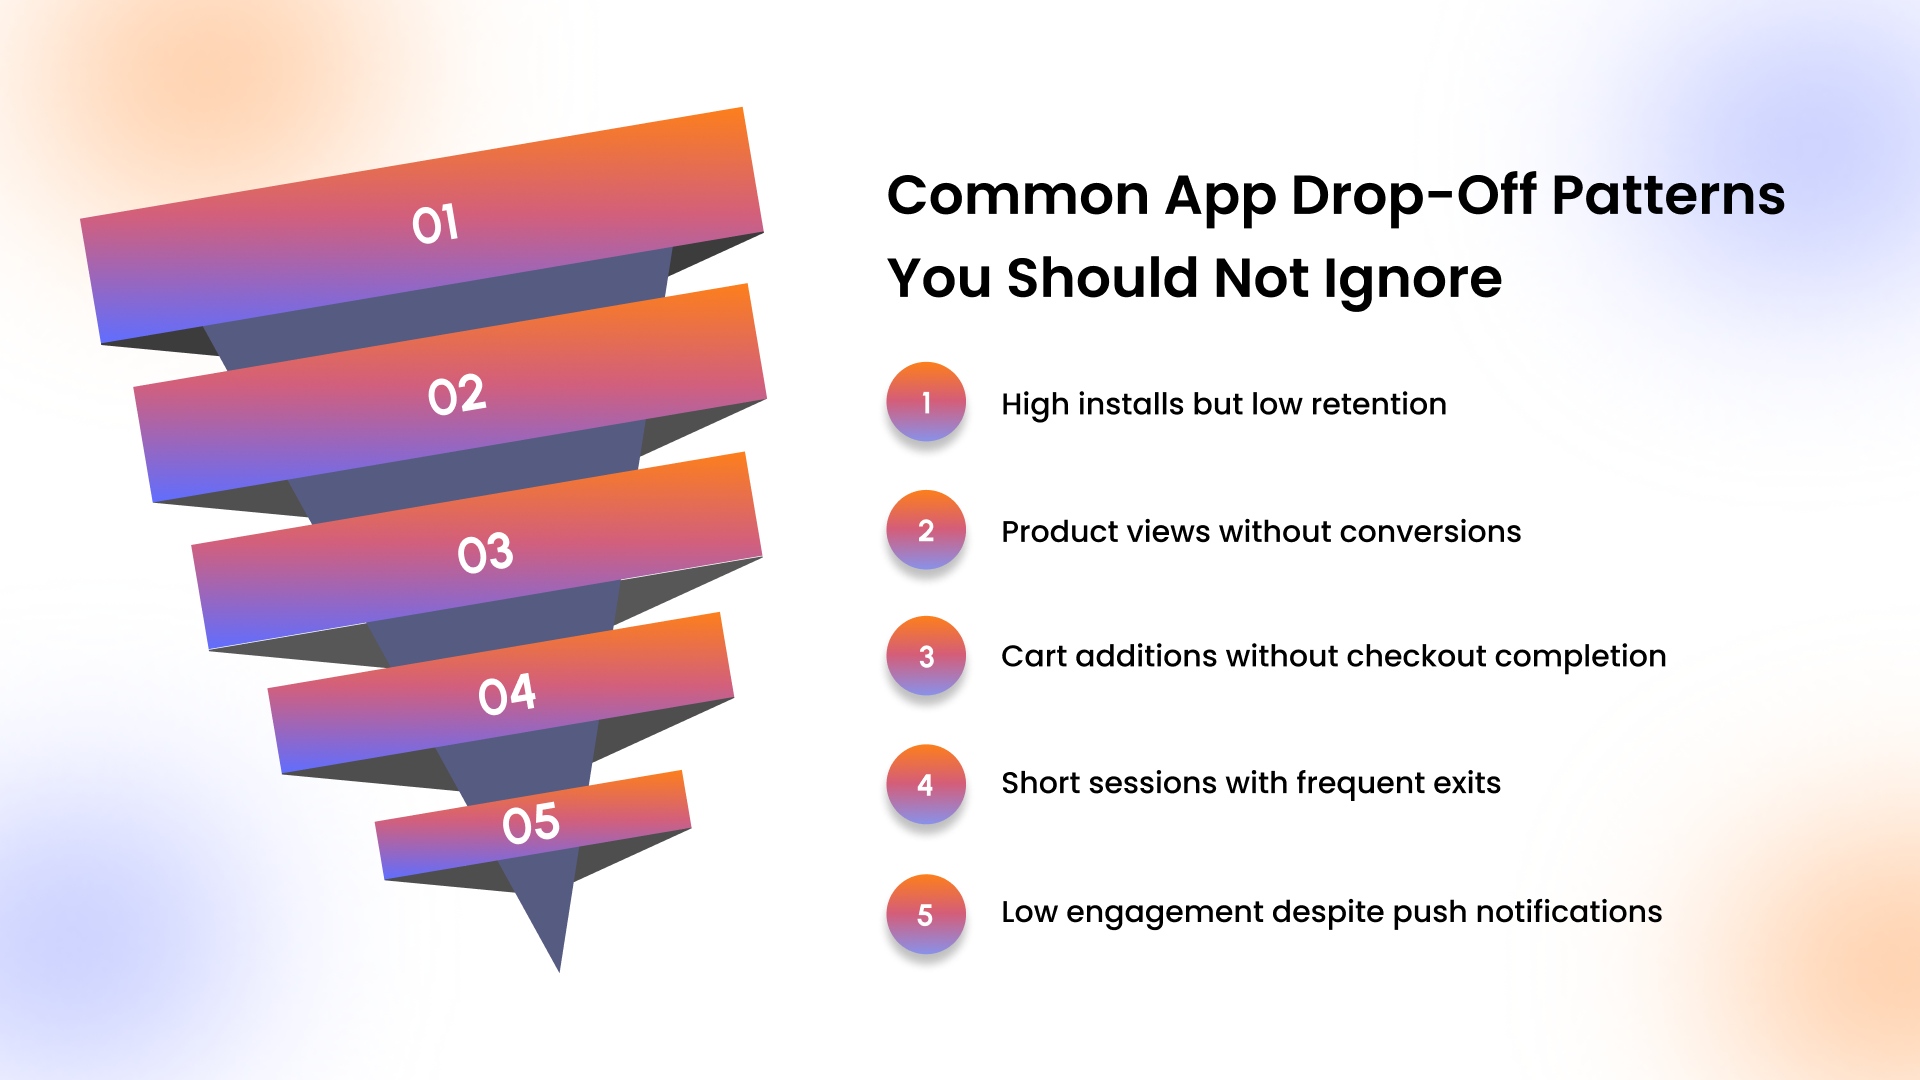
- High installs but low retention: Strong acquisition with weak retention signals unclear onboarding, delayed value delivery, or lack of immediate user motivation.
- Product views without conversions: High browsing activity but low purchases often indicate pricing hesitation, weak trust signals, or insufficient product information.
- Cart additions without checkout completion: Abandonment at this stage reflects friction like hidden costs, complex checkout flows, or limited payment flexibility.
- Short sessions with frequent exits: Repeated short visits suggest users cannot quickly find relevant content due to poor navigation or slow performance.
- Low engagement despite push notifications: Appmaker study found that push notifications can deliver 5-10 times higher click-through rates than email, but poor timing or irrelevant messaging reduces their actual impact.
To act on these drop-off patterns, Appmaker gives you the control to build and continuously refine your mobile app experience without relying on development cycles.
How Do You Reduce Drop-off Rate in a Mobile App in 2026?
Identifying drop-off points only matters when those insights translate into targeted fixes that improve engagement and long-term retention.
Here are the most effective ways to turn app data into actions that directly reduce drop-offs and increase user value.
- Simplify high-friction screens: Reduce unnecessary steps, improve loading speed, and remove clutter to help users complete actions without hesitation.
- Strengthen onboarding and first interactions: Guide users toward a clear first action quickly, ensuring they understand value within the first session.
- Personalize content and user journeys: Use behavioral data to show relevant products, offers, and content that align with user preferences and intent.
- Improve timing of engagement triggers: Trigger push notifications and in-app messages based on user actions instead of generic schedules to increase relevance.
- Align subscription and retention strategies: Short-term plans often see faster drop-offs, with weekly subscriptions reaching nearly 32% retention within one month, making longer-commitment models more stable for sustained engagement.
Fixes become more effective when placed in context, and that is where comparing your app against market patterns adds clarity.
How Competitive Mobile App Data Helps Brands Grow?
Looking beyond internal metrics helps retailers understand how their app performance compares and where real opportunities exist.
Here are the ways competitive mobile app data helps refine strategy and improve performance outcomes.
- Benchmark performance against competitors: Comparing retention, conversion rates, and engagement helps identify whether current performance is above or below market standards.
To make this comparison meaningful, it is important to understand how retention varies across industries.
For eCommerce apps, retention tends to drop faster after initial sessions due to intent-driven user behavior.Comparing your app stats against these benchmarks helps identify whether drop-offs are expected or need immediate attention.
- Identify missed revenue opportunities: Competitive insights reveal features, flows, or experiences driving higher conversions in similar retail apps.
- Refine acquisition and retention strategies: Understanding how competitors drive repeat usage helps improve targeting, personalization, and lifecycle campaigns.
- Improve return on ad spend with mobile insights: Appmaker study has claimed that mobile apps can help predictably reduce costs while driving over 20% higher return on ad spend, making performance benchmarking critical for scaling efficiently.
- Align product decisions with market expectations: Competitive data ensures updates and features are based on proven patterns rather than internal assumptions alone.
External insights help shape direction, but real improvements happen inside the app experience where those decisions are applied.
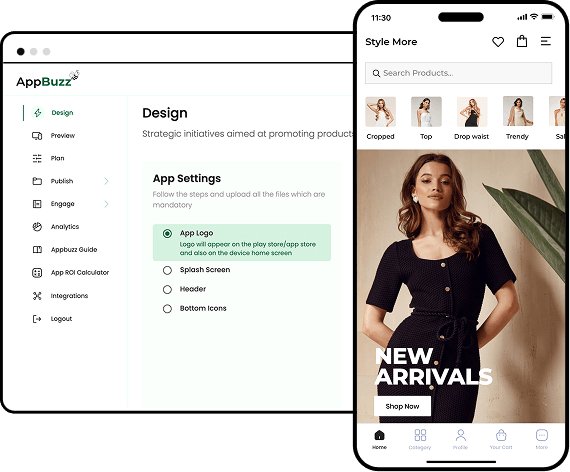
How Appmaker Helps You Build and Improve Your Mobile App?
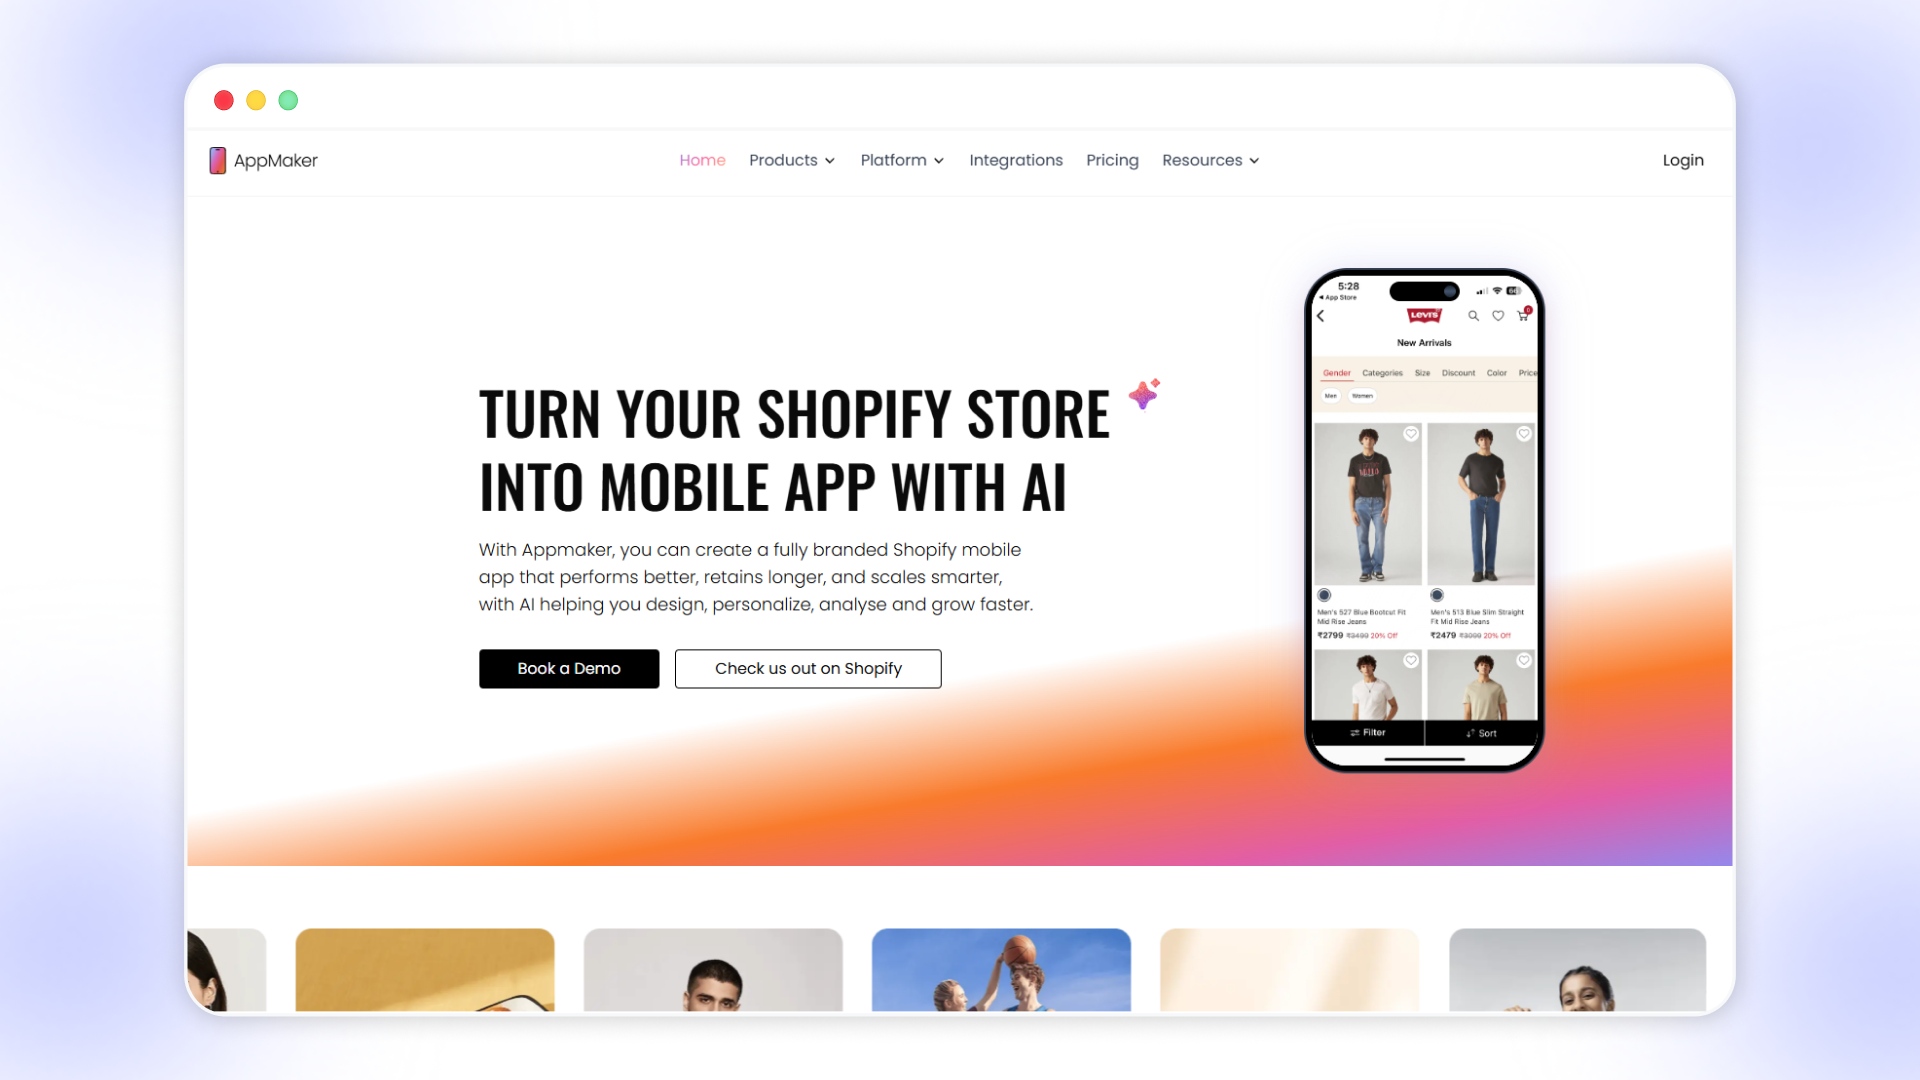
Acting on app stats requires a mobile app setup where changes can be implemented quickly without technical bottlenecks.
Here are the ways Appmaker, as a no-code mobile app builder, enables you to create and refine your app experience.
- Use John AI to simplify analysis: Instead of digging through dashboards, John AI answers questions like “why did conversions drop” or “which campaign drove LTV” in real time.
- Drag-and-drop control over app experience: Appmaker Studio lets you design homepages, product displays, and navigation flows based on user behavior insights.
- Real-time Shopify sync for consistent experiences: Products, inventory, and customer data stay updated across your store and mobile app without manual intervention.
- AI-driven personalization for better engagement: Tools like Eidolon AI and evolving solutions like Rubik’s AI adjust layouts, recommendations, and content based on user behavior.
- Personalization built into the app experience: Conditional Blocks allow different users to see tailored content based on behavior, improving relevance and engagement.
- Keep data consistent across touchpoints: Real-time Shopify sync ensures product, customer, and order data reflect accurately inside the app for better decision-making.
- Scale improvements as your app grows: Code Blocks and extensions allow deeper customization when basic changes are not enough to fix drop-offs.
Once the right tools and approach are in place, the focus shifts to applying these changes consistently for better results.
Wrapping Up
App stats only become valuable when they clearly explain where users drop off and what needs immediate attention.Consistent analysis, combined with targeted fixes, helps improve retention, engagement, and overall conversion performance across your app.
Appmaker enables faster iteration by giving full control to build and refine your mobile app experience based on user behavior.
Turn insights into real improvements inside your app. Book a Demo with Appmaker to see how faster changes drive better retention.
FAQs
What is a good retention rate for a mobile app?
A good mobile app retention rate depends on the category, but Day 1 retention typically ranges between 20% to 30% for most apps. Higher-performing apps focus on onboarding, personalization, and consistent value delivery to keep users returning beyond the first session.What is the average Day 30 app retention rate?
The average Day 30 retention rate for mobile apps is usually below 10% across most industries. This sharp drop highlights the importance of long-term engagement strategies such as personalized content, timely notifications, and continuous app improvements to retain users over time.How do I track drop-off points in my Shopify app?
Drop-off points in a Shopify app can be tracked using funnel analysis, screen flow tracking, and user journey mapping. Monitoring transitions between product views, cart additions, and checkout helps identify where users exit and what friction points affect conversions.What causes users to abandon apps after one session?
Users often abandon apps after one session due to unclear onboarding, slow performance, or lack of immediate value. If users cannot quickly understand how the app benefits them or complete a meaningful action, they are less likely to return.What tools track mobile app funnel drop-off?
Mobile app funnel drop-off can be tracked using analytics tools that offer funnel visualization, session tracking, and user flow analysis. These tools help identify where users exit during key journeys, enabling teams to fix friction points and improve overall conversion rates.