

























Key Takeaways
- Black Friday falls on November 27, 2026, and Cyber Monday on November 30. Lock inventory, offers, and creative assets by late October.
- Deloitte forecasts US holiday ecommerce of $316.1 to $318.9 billion this season, growing 7.5 to 8.4 percent and outpacing total retail.
- Mobile drove 70 percent of Cyber Week 2025 orders worldwide. Design and test the phone experience as your primary storefront.
- A 0.1-second mobile speed gain lifted retail conversions 8.4 percent in Google and Deloitte research. Performance work is revenue work.
- About 70 percent of carts are abandoned. Extra costs at checkout are the top fixable reason, so show landed cost early.
- Klaviyo data shows automated flows convert at 13 times campaign rates. Build triggered journeys before you write a single broadcast email.
- Judge BFCM on 90-day repeat purchase rate and contribution margin. Weekend revenue alone hides discount damage and one-time buyers.
At 12:01 pm Eastern on Black Friday last year, Shopify merchants were selling $5.1 million worth of product every minute. That is the number everyone quotes in November.
Here is the one almost nobody quotes. When the National Retail Federation surveyed shoppers at the end of Cyber Monday, they reported that 53 percent of their holiday shopping was still ahead of them.
Both things are true at once, and together they explain a pattern we see every year: a brand posts a record BFCM weekend, celebrates, and then spends January quietly wondering where the growth went. The weekend is a spike in demand, not a conclusion. Most teams plan in detail for the spike and barely at all for the eight weeks on either side of it.
There is a second problem, and it is quieter. Traffic is getting more expensive while converting less well. Salesforce's Shopping Index recorded global digital traffic up 18 percent in Q2 2026 against order volume up 1 percent. Bain expects more than half of this season's nominal sales growth to come from inflation rather than real demand. A bigger revenue number is no longer proof that you had a better year, which means the old BFCM instinct of buying more traffic and discounting harder is now an expensive way to stand still.
This guide is built for the ten weeks between today and Black Friday on November 27, 2026. It covers what to do, when to do it, and which parts actually move contribution margin: demand forecasting, inventory, mobile performance, offer architecture, checkout, cart recovery, how email, SMS, and push work together rather than in parallel, personalization, AI and product feed readiness, fulfilment, retention, and the ninety days after Cyber Monday where the season's profit is genuinely decided.
Every statistic below links to its primary source. Forecasts are labelled as forecasts. Where the evidence is thin or vendor-reported, including where it comes from AppMaker's own customers, it says so.
Quick answer: BFCM ecommerce is online retail activity across the Black Friday and Cyber Monday window. In 2026, that window runs from Thanksgiving on Thursday, November 26 through Cyber Monday, November 30. For D2C brands, preparing well means forecasting units rather than revenue, designing offers that protect contribution margin, making the mobile experience genuinely fast, and orchestrating owned channels (email, SMS, push, and a branded app) so peak traffic produces repeat customers rather than one-time discount hunters. Serious preparation starts 10 to 12 weeks out, which means now.
BFCM Ecommerce in 2026: The 60-Second Briefing
Every number below links to its original source. Figures are labelled verified (completed periods) or forecast (projections).
| Data point | Figure | Status |
|---|---|---|
| Black Friday 2026 | Friday, November 27 | Calendar |
| Cyber Monday 2026 | Monday, November 30 | Calendar |
| US holiday ecommerce, 2026 to 2027 season | $316.1B to $318.9B, up 7.5 to 8.4 percent | Forecast (Deloitte) |
| US Nov to Dec retail sales, 2026 | Above $1 trillion for the first time, up 4.5 percent | Forecast (Bain) |
| Holiday ecommerce traffic from AI chat agents, 2026 | 20 percent | Forecast (Salesforce) |
| US online spend, 2025 holiday season | $257.8 billion, up 6.8 percent | Verified (Adobe) |
| Cyber Monday 2025 US online spend | $14.25 billion, up 7.1 percent | Verified (Adobe) |
| Black Friday 2025 US online spend | $11.8 billion, up 9.1 percent | Verified (Adobe) |
| Shopify merchant BFCM GMV, 2025 | $14.6 billion, up 27 percent | Verified (Shopify) |
| Mobile share of Cyber Week orders, 2025 | 70 percent globally and in the US | Verified (Salesforce) |
| Average documented cart abandonment rate | 70.22 percent across 50 studies | Verified (Baymard) |
| Shopping still remaining after Cyber Monday 2025 | 53 percent, per shoppers surveyed | Verified (NRF) |
That last row is the one most brands ignore. After the biggest shopping weekend of the year, consumers told NRF they still had more than half their holiday shopping left to do. BFCM is not the finish line. It is the qualifying round.
What BFCM Ecommerce Actually Means Now
BFCM ecommerce refers to the concentrated online shopping event running from Thanksgiving Thursday through Cyber Monday. That is still the textbook definition. It is also increasingly wrong in two ways, and both have planning consequences.
The event is no longer five days: Adobe recorded 25 separate days above $4 billion in US online spend during the 2025 season, up from 18 in 2024. Cyber Week contributed $44.2 billion of the season's $257.8 billion total. Plan only for the five days, and you hand the shoulders of the curve to competitors who started in early November.
The event is no longer a website event: Salesforce measured 70 percent of Cyber Week 2025 online orders coming from mobile devices, with mobile wallets used for 27 percent of global orders. Adobe put smartphones at 56.4 percent of all US online transactions across the full season, up from 54.5 percent.
If your BFCM planning still begins with a desktop homepage mockup and ends with an email calendar, you are preparing for the 2019 version of this event.
BFCM 2026 Dates and the Demand Outlook
The calendar
| Date (2026) | Event | What it means operationally |
|---|---|---|
| Sept 15 to Oct 15 | Planning | Forecasting, inventory commitments, data hygiene, audience growth |
| Oct 15 to Nov 5 | Build | Offers locked, creative produced, flows built, performance fixes shipped |
| Nov 6 to Nov 20 | Warm-up | Waitlists, teasers, load testing, code freeze |
| Nov 21 to Nov 25 | Early access | Loyalty and app pre-sale, final QA, war room staffing |
| Thu Nov 26 | Thanksgiving | Historically among the highest mobile-share days of the year |
| Fri Nov 27 | Black Friday | Peak traffic typically clusters around midday US Eastern |
| Sat Nov 28 to Sun Nov 29 | Cyber Weekend | Gifting and bundle demand |
| Mon Nov 30 | Cyber Monday | Historically the single largest online spend day of the year |
| Dec 1 to Dec 20 | Green Monday and shipping cutoffs | Second-purchase window, gift cards, replenishment |
| Dec 21 to Jan 31 | Post-peak | Returns, win-back, cohort analysis, loyalty enrolment |
What the forecasters expect (projections, not results)
| Source | 2026 forecast | Published |
|---|---|---|
| Deloitte | US holiday retail of $1.70T to $1.71T (Nov 2026 to Jan 2027), up 4.0 to 4.8 percent. Ecommerce of $316.1B to $318.9B, up 7.5 to 8.4 percent | Sept 10, 2026 |
| Bain & Company | US Nov to Dec sales above $1 trillion for the first time, up 4.5 percent. In-store up 2.5 percent, nonstore up 9 percent. More than half of nominal growth from inflation | Sept 3, 2026 |
| Salesforce | 20 percent of holiday ecommerce traffic from AI chat agents. One in three ecommerce sites running a site-specific shopper agent by Cyber Week. Social commerce growing at 9x the rate of traditional ecommerce | July 20, 2026 |
The National Retail Federation and Adobe Analytics typically publish their seasonal forecasts in October and November, so neither had released a 2026 holiday number at the time of writing. For context, NRF's full-year 2026 forecast calls for US retail sales growth of 4.4 percent to $5.6 trillion.
Read the forecasts carefully. Ecommerce is projected to grow roughly twice as fast as total retail, but Bain is explicit that more than half the nominal increase comes from inflation. If your average selling price rises with the market while unit velocity stays flat, a bigger revenue number can still mean a worse year on contribution margin. Forecast units first.
What actually happened in 2025
| Metric | Result | Source |
|---|---|---|
| Cyber Monday US online spend | $14.25 billion, up 7.1 percent | Adobe |
| Black Friday US online spend | $11.8 billion, up 9.1 percent | Adobe |
| Thanksgiving Day US online spend | $6.4 billion, up 5.3 percent | Adobe |
| Cyber Week US online spend | $44.2 billion, up 7.7 percent | Adobe |
| Global Cyber Week sales, all channels | $336.6 billion, up 7 percent | Salesforce |
| Shopify merchant GMV over BFCM | $14.6 billion from 81 million+ buyers, up 27 percent | Shopify |
| Shopify average cart price | $114.70 | Shopify |
| Peak sales rate on Shopify | $5.1 million per minute at 12:01 pm EST on Black Friday | Shopify |
| US shoppers, Thanksgiving through Cyber Monday | Record 202.9 million, of whom 134.9 million shopped online | NRF |
| Buy Now Pay Later, full season | $20 billion, with 82.2 percent of it on smartphones | Adobe |
| Generative AI referral traffic to US retail | Up 693.4 percent year over year | Adobe |
Two figures deserve a second look. Shopify's peak of $5.1 million per minute tells you demand arrives as a spike inside a single hour, not as a gentle wave across a weekend. And the fact that 82.2 percent of BNPL purchases happened on a phone means payment flexibility and mobile checkout are one problem, not two.
Six Shifts That Should Change Your Black Friday Cyber Monday Ecommerce Strategy
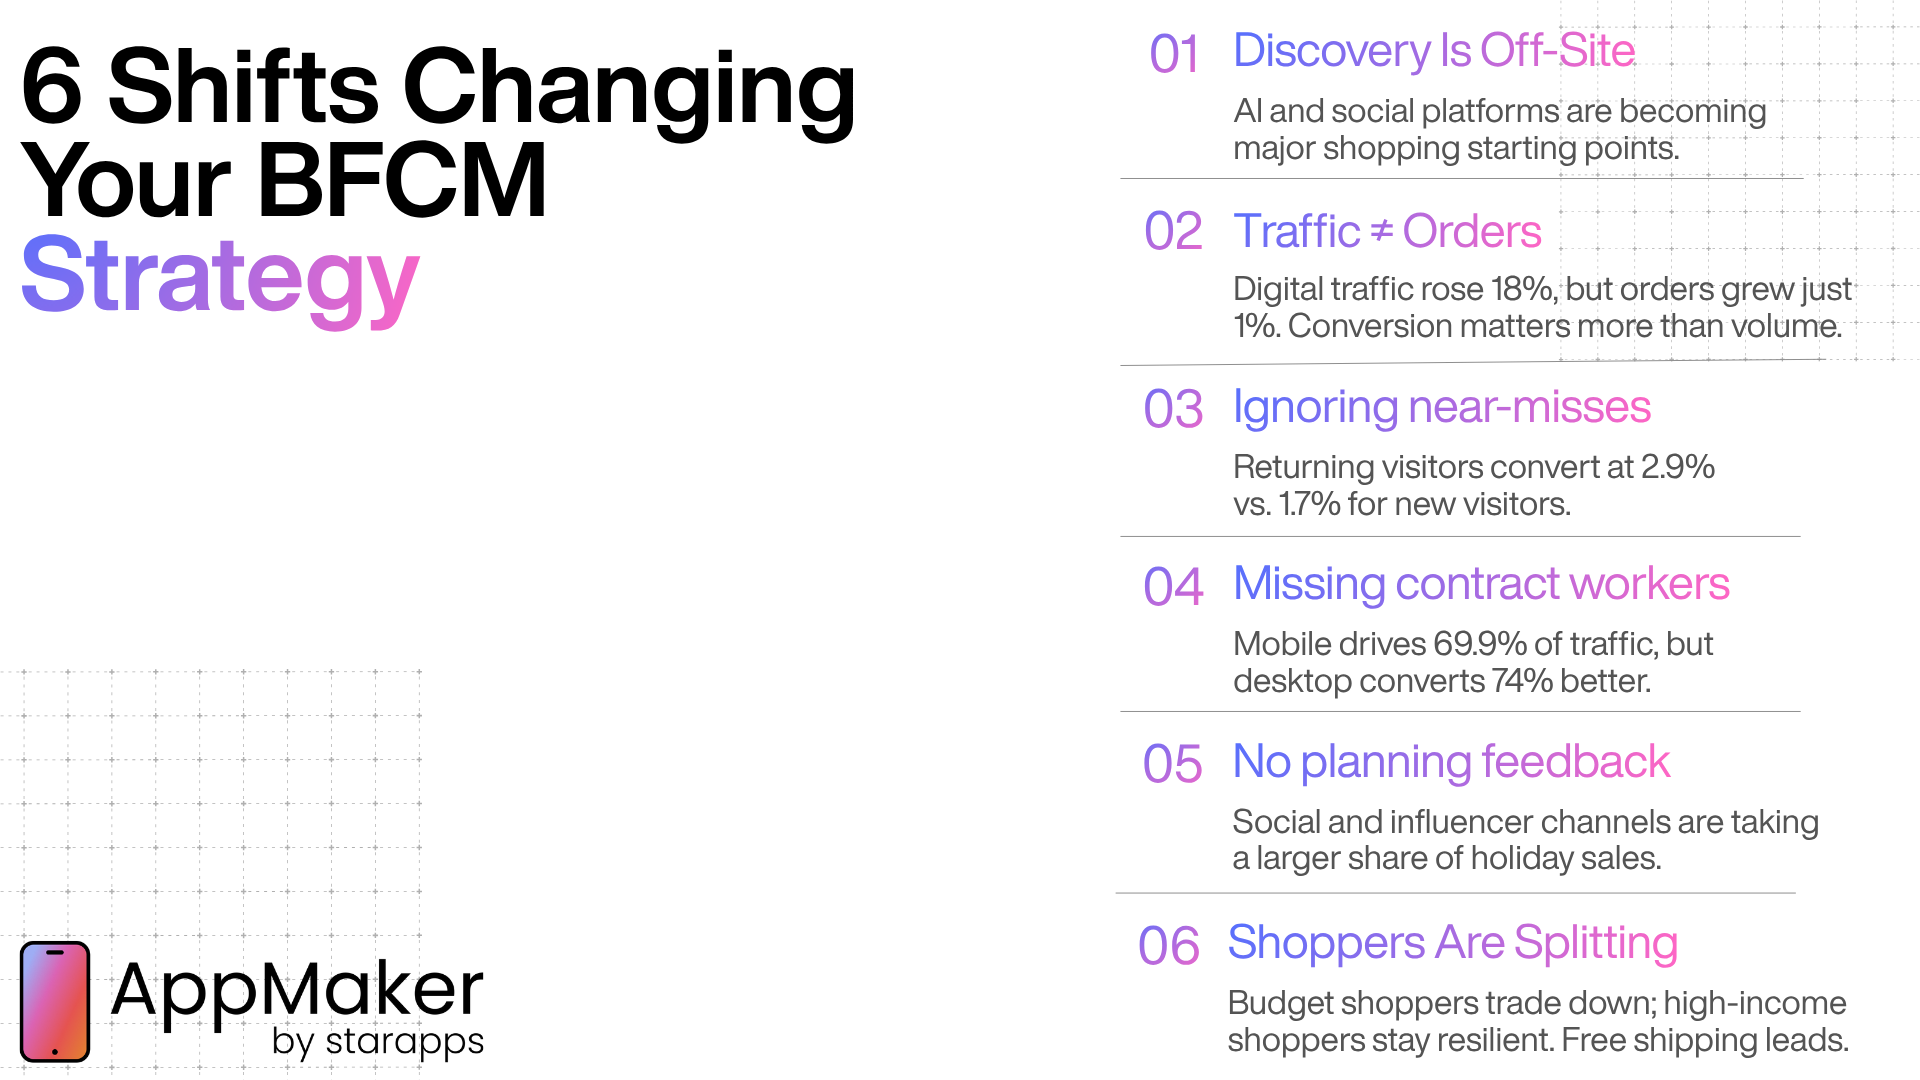
1. Discovery has moved off your website
Salesforce found engagement on brand-owned properties down 7 percent year over year while use of AI assistants and social media as shopping starting points jumped 38 percent. Half of shoppers now report using an AI assistant somewhere in the buying journey, and 74 percent say they trust the product recommendations it gives them.
Bain's 2026 consumer survey puts the same shift in plainer terms: 24 percent of online shoppers plan to start their holiday shopping on an AI platform, up from 17 percent last year, with a further 13 percent intending to use a retailer's own AI shopping agent.
2. Traffic is growing faster than orders
Salesforce's Shopping Index recorded global digital traffic up 18 percent in Q2 2026 while order volume rose 1 percent. More visits, same purchases.
This is the most consequential fact on the list. If traffic is easy to inflate and expensive to convert, buying more of it is the wrong response. Raising the value of the traffic you already own is the right one, which pushes retention, personalization, and owned channels from nice-to-have into the centre of the plan.
3. Returning visitors carry the business
Contentsquare's 2026 Digital Experience Benchmark, built on 99 billion sessions across more than 6,000 sites, found returning visitors converting at 2.9 percent against 1.7 percent for new visitors, with return visits making up 52.8 percent of all traffic. Conversion softened for both groups, but returning-visitor conversion fell roughly half as far.
4. Mobile has the traffic and the friction
The same dataset shows mobile at 69.9 percent of traffic while desktop conversion runs 74 percent higher. That is not an argument for deprioritizing mobile. It is a diagnosis. The surface carrying most of the demand is also carrying most of the friction, which makes it the highest-leverage thing you can fix before November.
5. Social is now a revenue channel, not an awareness channel
Adobe found social media's share of US holiday online revenue reached 4.6 percent in 2025, up 40.3 percent year over year, while affiliates and partners (which includes influencers) accounted for 20.4 percent of revenue share, up 15.9 percent. Salesforce separately reports social shops holding at 7 to 9 percent of total orders for brands that run them.
6. The consumer has split in two
Salesforce describes a K-shaped season in which 35 percent of holiday shoppers are actively trading down, while high-income shoppers stay resilient. Across every income band, one factor ranked first in deciding where to shop: free shipping. Salesforce forecasts retailers will spend an additional $3 billion globally subsidising it this season.
The planning move: build two offer tracks. A threshold-based, margin-protecting track for value-seeking shoppers, and an access-based track (early drops, exclusive bundles, priority service) for your highest-value segment that does not require going deeper on discount.
The BFCM Preparation Timeline: A 10-Week Plan
If you are reading this in mid-September 2026, you have roughly ten weeks. Here is what belongs in each of them.
| Weeks out | Window | Must be done | Owner |
|---|---|---|---|
| 10 to 8 | Sept 15 to Oct 5 | Unit-level demand forecast, inventory POs placed, margin floors set per SKU, data and tracking audit, list and push-audience growth campaigns live | Merchandising, finance |
| 8 to 6 | Oct 5 to Oct 20 | Offer architecture locked, creative brief signed off, performance audit complete, fulfilment capacity confirmed with 3PL | Marketing, ops |
| 6 to 4 | Oct 20 to Nov 3 | Creative produced, landing pages built, all lifecycle flows built and QA'd, customer service macros written and staffing booked | Marketing, CX |
| 4 to 2 | Nov 3 to Nov 17 | Load testing at 5x to 10x peak, warm-up campaigns live, early-access signups running, fraud rules reviewed | Engineering, growth |
| 2 to 1 | Nov 17 to Nov 24 | Code freeze, rollback plan documented, monitoring and alerting verified, war room roster and escalation path published | Engineering |
| 1 to 0 | Nov 24 to Nov 26 | VIP and app early access live, final inventory reconciliation, dress rehearsal on the deal-activation process | All |
| Peak | Nov 26 to Nov 30 | Execute. Monitor hourly. Change nothing structural | All |
| +1 to +3 | Dec 1 to Dec 20 | Second-purchase campaigns, shipping-cutoff urgency, gift cards | Lifecycle |
| +1 to +3 | Dec 1 to Dec 20 | Second-purchase campaigns, shipping-cutoff urgency, gift cards | Lifecycle |
| +4 to +10 | Dec 21 to Feb | Returns handling, cohort analysis, win-back, loyalty enrolment | Retention, finance |
Two rules make this timeline work. Anything requiring app store review, supplier lead time, or a 3PL contract change has to be decided in the first block. And anything that touches production code stops two weeks out, without exceptions, because the expected value of a late feature is almost always lower than the expected cost of a late bug.
Demand Forecasting for Peak Season
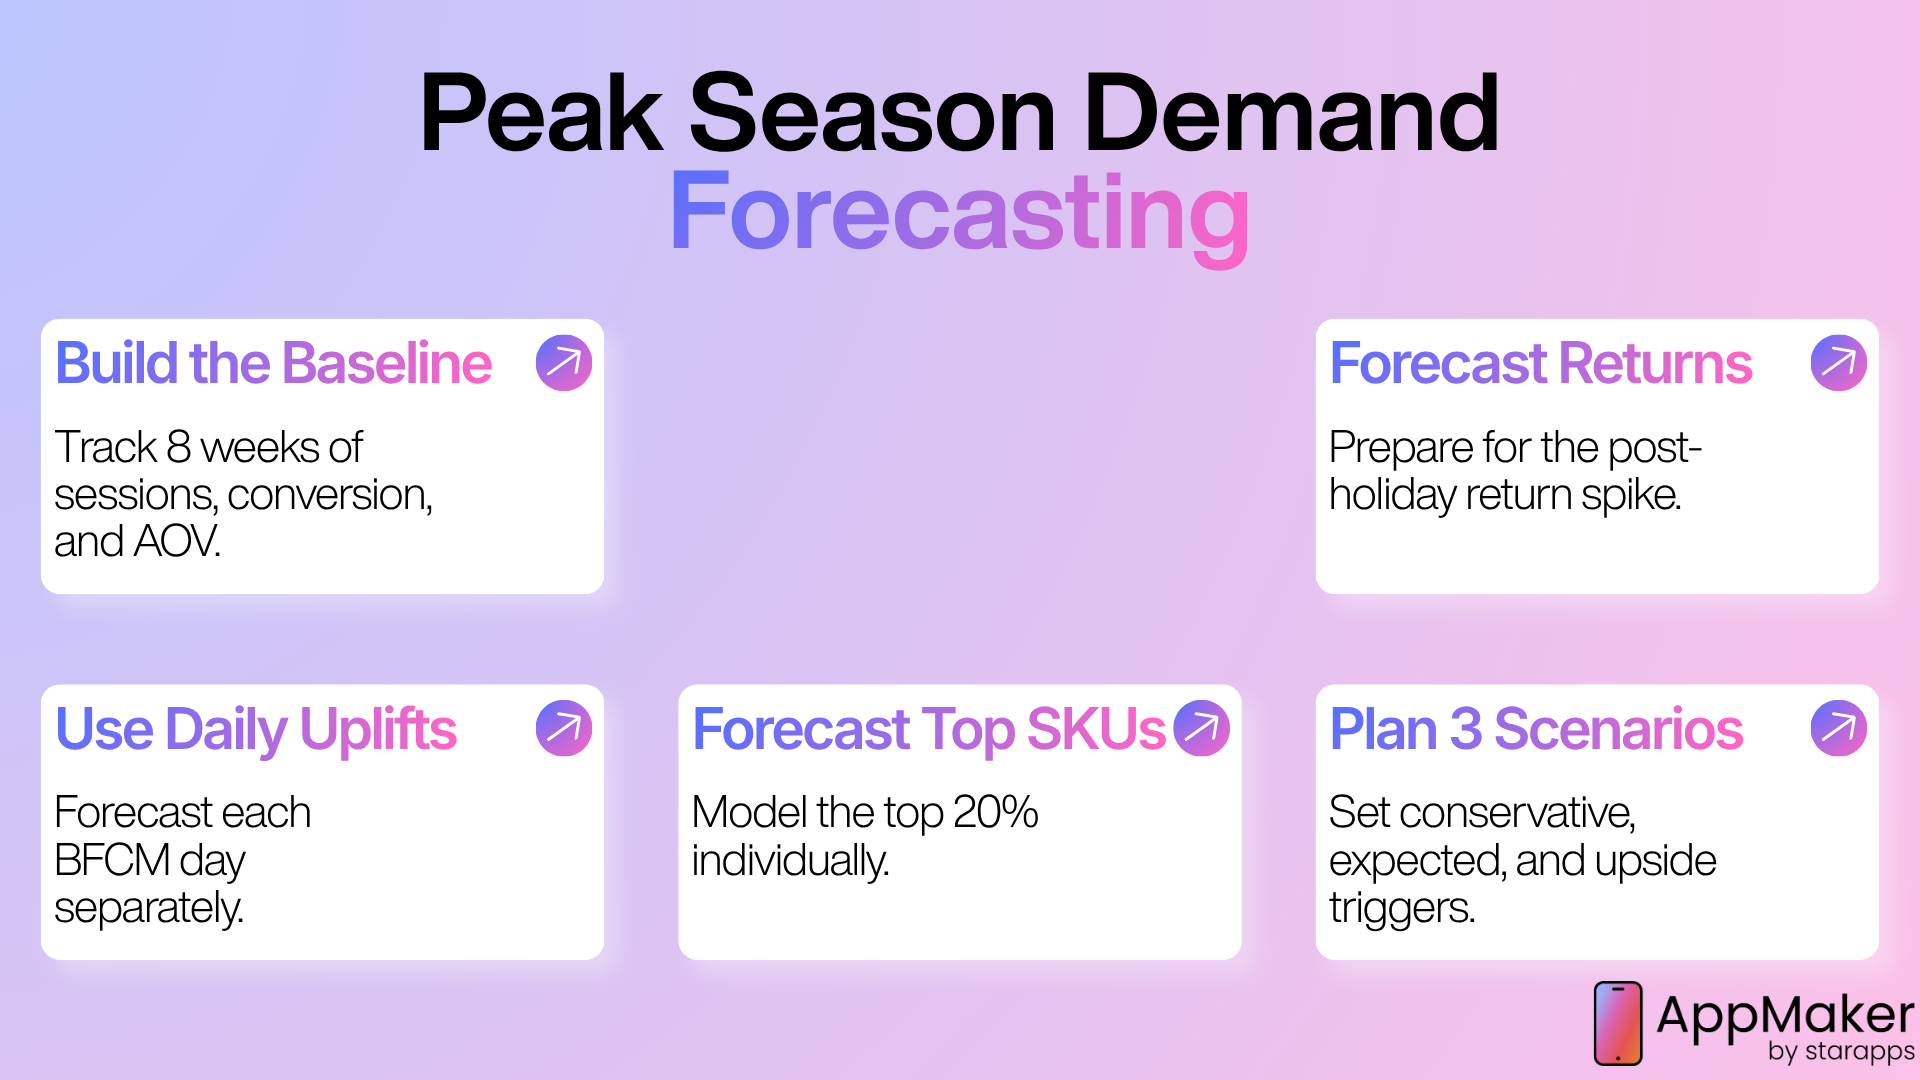
Most BFCM forecasts fail the same way. They start with a revenue target and reverse-engineer the inputs. Work forwards instead.
1. Build the baseline: Eight weeks of daily sessions, conversion rate, and AOV, split by device and channel. Everything else is a multiplier on this.
2. Apply a daily uplift factor, not a seasonal one: BFCM demand is not a flat lift. Pull the ratio of each peak day to your trailing baseline from your own history. For scale, Redseer found India's 2025 festive sale running at roughly 3.5 times business-as-usual GMV during its first 11 days.
3. Forecast the top 20 percent of SKUs individually: They will carry most of peak revenue and all of your stockout risk. Forecast the tail at category level and move on.
4. Build three scenarios with pre-committed triggers: Conservative (baseline uplift minus 20 percent), expected, and upside (plus 30 percent). Each gets an inventory position, a paid spend ceiling, and a CX staffing level. Decide now which signal on which day flips you between them, because nobody makes a good call about this at 2 am on Black Friday.
5. Forecast returns: Adobe found holiday returns down 1.2 percent in 2025 overall, but sharply concentrated afterwards: returns rose 4.7 percent between December 26 and 31, and roughly one in seven seasonal returns landed in that six-day window. Notably, 38.8 percent of returns happened on mobile against 56.4 percent of spend, so the return journey is still a desktop and email experience for most customers.
The error that costs the most: forecasting gross revenue and ignoring the discount rate. A 30 percent uplift at 40 percent off can deliver less contribution margin than a 10 percent uplift at 20 percent off. Model margin per scenario before you commit a single purchase order.
Inventory and Merchandising
Give every SKU a job
In a peak event, each product plays one of four roles. Blanket discounting happens when nobody has decided which is which.
| SKU role | Purpose | Discount posture | Risk if handled badly |
|---|---|---|---|
| Traffic driver | Wins the click, seeds the cart | Deepest discount, capped quantity | Cannibalizes full-price demand when uncapped |
| Margin carrier | Where profit is actually made | Light or none, bundled | Undersold through poor merchandising |
| Basket builder | Raises AOV through bundles and add-ons | Discounted only inside a bundle | Invisible without deliberate placement |
| Clearance | Frees working capital | Whatever moves it | Devalues the brand if it leads the page |
Benchmark your discount depth
Guessing at discount depth is expensive. Adobe publishes the actual peak discount levels US shoppers saw in the 2025 season, which is a far better anchor than what your competitor posted on LinkedIn:
| Category | Peak discount, 2025 season | 2024 comparison |
|---|---|---|
| Electronics | 30.9 percent | 30.1 percent |
| Toys | 29.6 percent | 28.0 percent |
| Apparel | 25.1 percent | 23.2 percent |
| Televisions | 24.3 percent | 24.2 percent |
| Computers | 23.4 percent | 22.8 percent |
| Sporting goods | 20.3 percent | 19.5 percent |
| Appliances | 20.2 percent | 19.2 percent |
| Furniture | 18.8 percent | 19.0 percent |
Source: Adobe Analytics
Adobe also found that those discounts pushed shoppers upmarket rather than down. The share of units sold in the most expensive price tiers rose 20 percent compared with the rest of the year, and 56 percent within electronics. Discounting worked as a trade-up mechanism, not just a margin sacrifice, which is an argument for discounting your premium tier rather than your entry tier.
Merchandising for peak behaviour
Peak shoppers browse differently. They arrive with intent, less patience, and a price anchor already set by something they saw somewhere else.
- Collapse the navigation: Your BFCM landing surface should expose offers, not taxonomy. Deal collections, price-band collections, and gift-recipient collections beat your normal category tree.
- Put the offer in the product card: Strike-through price, percentage saved, and stock urgency belong in the grid, not only on the product page.
- Sort by conversion, not by newness: Promoting proven converters to the top of collections is among the cheapest lifts available in the final fortnight.
- Personalize the first screen: A customer who bought running shoes in March should not land on the same hero banner as a first-time visitor from a TikTok ad.
AppMaker's App Conditional Blocks handle the last point inside a native app without shipping a new build.
Decide your stockout policy before the weekend
When a bestseller sells out at 4 pm on Black Friday, you want the answer already written down. Backorder, waitlist, or substitution merchandising? A waitlist that captures an email, phone number, or push token converts a stockout into an owned-audience gain. And real-time inventory sync across storefront, app, and any social shop is what stands between a busy weekend and a January spent issuing refunds.
Site and App Performance: The Least Glamorous Revenue Lever
Speed improves every downstream metric at once, and it is reliably the last thing teams get to.
The evidence here is unusually clear. In research Google commissioned with Deloitte, across 37 brand sites and more than 30 million sessions, a 0.1 second improvement in mobile site speed was associated with retail conversions rising 8.4 percent and average order value rising 9.2 percent. That study ran on pre-Core Web Vitals metrics, so treat the exact percentages as directional, but the direction has held up across every replication since.
Peak-readiness checklist
| Area | Target | Deadline |
|---|---|---|
| Core Web Vitals on key templates | LCP under 2.5s, INP under 200ms, CLS under 0.1 | 6 weeks out |
| Third-party scripts | Audit every tag, remove or defer anything not tied to revenue or compliance | 6 weeks out |
| Image weight | Modern formats, correct sizing, lazy loading below the fold | 5 weeks out |
| Load testing | Simulate 5x to 10x expected peak-minute traffic, including checkout and payment | 4 weeks out |
| Code freeze | No non-critical deploys | 2 weeks out |
| Rollback plan | Documented, tested, single named owner | 2 weeks out |
| Monitoring | Alerting on checkout errors, payment failures, add-to-cart failures | 1 week out |
| Degradation plan | Pre-agreed list of what gets switched off under load | 1 week out |
Two peak-specific points generic advice misses. Load-test the checkout and payment path, not the homepage, because that is where a queue turns into lost revenue. And agree in advance what you will turn off under pressure. Disabling the live chat widget, reducing personalization depth, and serving cached collection pages are decisions worth making in October rather than improvising at 12:01 pm on Black Friday.
Native apps have a structural head start here, since assets, fonts, and layout shells ship with the install instead of downloading on every session. AppMaker's breakdown of mobile app conversion rate drivers covers how load behaviour diverges between app and mobile web under load.
Conversion Optimization and Checkout
Fix the cart before you touch the ad budget
Baymard Institute's meta-analysis of 50 studies puts average documented cart abandonment at 70.22 percent. Baymard usefully separates unavoidable abandonment from fixable abandonment: 42 percent of US shoppers say they abandoned because they were browsing and not ready to buy. Strip that group out and what remains is mostly design debt.
| Reason for abandonment | Share | Fixable |
|---|---|---|
| Extra costs too high (shipping, tax, fees) | 40% | Yes |
| Delivery too slow | 20% | Partly |
| Did not trust the site with card details | 19% | Yes |
| Site required account creation | 18% | Yes |
| Checkout too long or complicated | 17% | Yes |
| Website errors or crashes | 17% | Yes |
| Returns policy unsatisfactory | 13% | Yes |
| Could not see total cost up front | 12% | Yes |
Source: Baymard Institute
Baymard's benchmarking also found the average US checkout showing 23.48 form elements by default against an ideal of 12 to 14. They estimate that checkout design improvements alone represent a 35.26 percent average conversion uplift opportunity, equal to roughly $260 billion in recoverable orders across the US and EU.
Seven checkout priorities for BFCM 2026
- Show landed cost early: Shipping, duties, and taxes visible at cart, or a calculator above the fold. This addresses the single largest fixable cause of abandonment.
- Guest checkout, always: Offer account creation after the purchase.
- Express wallets above the form: Mobile wallets carried 27 percent of global Cyber Week orders. Apple Pay, Google Pay, Shop Pay, and regional equivalents belong at the top.
- Offer BNPL where category fits: Adobe recorded $20 billion in BNPL holiday spend, 82.2 percent of it on phones. For considered purchases above your AOV, the payment method is the conversion lever.
- Cut form fields: Address autocomplete, single-field name entry, smart country and currency defaults.
- Set the free shipping threshold just above AOV: Free shipping ranked as the top decision factor across every income band in Salesforce's research. A threshold near 1.2 times AOV lifts basket size while capping the subsidy.
- Put the returns policy in the cart: Thirteen percent of fixable abandonment traces to returns policy, and during gifting season that number rises.
Abandoned Cart Recovery During Peak Week
Recovery behaves differently during BFCM because deal windows are short. A four-hour delay on the first reminder can miss the sale entirely.
- Compress the timing: First touch at 30 to 60 minutes rather than the usual one to four hours. Second touch the same day. Third before the offer expires.
- Sequence across channels; do not duplicate: Push first for app users because it is instant and free at the margin, then email, then SMS reserved for the highest-value carts.
- Do not stack a discount immediately: The discount is already live. Reminding someone the price ends in six hours is stronger than handing them another code, and it protects the offer's integrity.
- Separate browse abandonment from cart abandonment: Different intent, different message, different expected return. Browse abandonment converts lower but reaches a far larger audience.
- Watch for silent failures: A spike in abandonment on one payment method or one device type during peak is usually a bug, not consumer behaviour.
Offer Architecture: Discount Without Destroying Margin
Most BFCM offer plans amount to a single percentage chosen by looking at what competitors did last year. Treat the offer as a structure instead.
| Offer type | What it protects | Best for | Watch out for |
|---|---|---|---|
| Sitewide percentage off | Simplicity and traffic | High gross margin, low AOV catalogues | Cannibalizes full-price demand, hardest to unwind |
| Tiered spend thresholds | AOV and margin | Most D2C catalogues | Thresholds set too high suppress conversion |
| Bundles and kits | Margin and units per order | Complementary catalogues, gifting | Needs real merchandising and inventory work |
| Gift with purchase | Headline price integrity | Premium and beauty | Gift COGS must be modelled properly |
| Early access windows | Loyalty and owned-audience growth | Brands with an app or a strong list | Needs a genuine reason to sign up |
| Channel-exclusive offers | Channel migration | Brands building an owned audience | Only works if genuinely exclusive |
Three decisions to make in October
Depth versus duration. A steep discount over 72 hours creates urgency and protects the rest of Q4. A shallow discount over three weeks builds volume but teaches customers to wait. Choose deliberately rather than drifting into both.
Where exclusivity lives. If every channel gets the same offer at the same minute, no channel builds an audience. A 12- to 24-hour head start for app users or loyalty members costs nothing in discount depth and leaves you with a durable asset in January. AppMaker's own BFCM mobile commerce resource is built around this mechanic.
Your margin floor. Contribution margin after discount, shipping subsidy, payment fees, and expected return rate. Set it per SKU and enforce it in the promotion engine, not in a spreadsheet nobody opens on Black Friday.
Paid Media Pacing During Peak
Paid acquisition behaves badly during Cyber Week in predictable ways, and the fixes are mostly about pacing rather than creative.
- CPMs inflate, so front-load and back-load. The most efficient paid windows are usually early November (before auction pressure peaks) and the first ten days of December (after it releases). Budget accordingly rather than dumping everything into the weekend.
- Shift budget toward retargeting and owned-audience lookalikes during peak. Prospecting efficiency is worst exactly when competition is highest.
- Attribution will break, and you should plan for that. Compressed purchase windows, cross-device journeys, and AI-referred traffic all degrade last-click reporting. Agree before the event which measurement you will trust for in-flight decisions, and run a proper post-season reconciliation against contribution margin rather than platform-reported ROAS.
- Protect a slice of budget for app installs if you have an app. Install cost is lower when you are already paying for the traffic, and the asset persists after the season ends.
- Treat social as a conversion channel. Adobe measured social's share of US holiday online revenue up 40.3 percent year over year in 2025. Creative built for the feed-to-checkout path now deserves the same rigour as your paid search copy.
Customer Communication: How the Channels Actually Work Together
The common mistake is treating email, SMS, and push as three formats for the same message. They have different physics and different tolerances.
| Channel | Best BFCM job | Realistic peak cadence | Main constraint |
|---|---|---|---|
| Offer explanation, catalogue depth, gift guides, storytelling | 1 to 2 per day on peak days | Inbox competition is at its annual worst | |
| SMS | Time-critical urgency, drop alerts, high-value cart recovery | 2 to 4 across the whole window | Cost per send, opt-out risk, regulation |
| App push | Instant re-engagement, restocks, price drops, app-exclusive access | Multiple per day if properly segmented | Requires install plus opt-in, fatigue is real |
| Web push | Reaching mobile web visitors who have not installed the app | 1 to 2 per day | Lower intent, browser limitations |
| Conversational support, order updates, catalogue browsing in India and similar markets | Template-governed | Approval process, per-message cost | |
| Paid retargeting | Reaching lapsed customers and non-subscribers | Continuous | CPMs inflate sharply during Cyber Week |
Build flows before campaigns
Klaviyo's 2026 benchmarks, drawn from more than 205,000 brands, show automated flows beating one-off campaigns on every metric: a 5.58 percent click rate against 1.69 percent, and a 2.11 percent placed order rate against 0.16 percent. That is roughly 13 times the conversion rate. Klaviyo also found flows generating close to 41 percent of email revenue from just 5.3 percent of sends.
The implication for BFCM is direct. Your flows earn more per send than your campaigns will, and they run whether or not anybody on your team is awake.
Minimum flow set for peak:
- Welcome and early-access flow, running from now to grow the list before the event
- Browse abandonment
- Cart abandonment with compressed peak-week timing
- Back-in-stock, consistently among the highest revenue-per-recipient automations
- Price drop and offer-live alert
- Post-purchase sequence: shipping expectation, cross-sell, review request
- Second-purchase nudge timed to your category's replenishment cycle
- Sunset and re-engagement flow, so your peak sends land in the inbox rather than the promotions graveyard
Push notification discipline
Airship analysed more than 681 billion push notifications sent to over 3 billion users across 15 verticals for its 2026 benchmarks. Two findings recur across every serious dataset in this space: relevance beats volume, and a push opt-out is effectively permanent in a way an email unsubscribe is not.
For BFCM that means:
- Segment by behaviour, not by list. A push to everyone is a push to nobody.
- Cap frequency per user, not per campaign. Somebody in three segments should not get three messages in an hour.
- Deep link every message. A push that opens the home screen wastes the intent it just created.
- Earn the opt-in before the season. Ask for permission after the user has seen value, not on first launch.
- Keep a quiet-hours rule. The revenue from a 2 am push rarely covers the opt-outs it triggers.
Practical strategy and copy examples live in Personalized push notifications: best practices and use cases and 20 push notification examples that actually get clicked. For tooling decisions, Top mobile push notification services for 2026 compares the main platforms.
Personalization That Changes Behaviour
Personalization during BFCM is mostly a merchandising problem wearing a technology costume. Three tiers, in order of effort and payoff.
Tier 1: Segment-level: Split into first-time visitor, engaged non-buyer, one-time buyer, repeat buyer, and lapsed. Give each a different hero offer, subject line, and push message. Almost every D2C brand already owns the tooling to do this, and most still do not.
Tier 2: Behaviour-triggered: Restock alerts, price-drop alerts, replenishment reminders, all based on what the individual actually did. Low volume, high relevance, high conversion.
Tier 3: Session-level adaptation: Reordering collections, swapping recommendation modules, adjusting home screens mid-session. Native apps have an advantage here because identity and history persist across sessions without depending on cookies.
The economics follow directly from the Contentsquare data above: returning visitors convert at nearly double the rate of new ones and already make up more than half of traffic. Personalization is how you keep that cohort converting when every competitor is shouting the same percentage at them.
AI and Agentic Commerce Readiness

This is the section that did not exist in a BFCM guide three years ago, and it is now the one with the shortest window to act.
What the data says: Adobe measured generative AI referral traffic to US retail sites up 693.4 percent across the 2025 season, with a 670 percent increase on Cyber Monday alone. Adobe notes the absolute base remains modest. Salesforce forecasts 20 percent of 2026 holiday ecommerce traffic originating from AI chat agents, and predicts one in three ecommerce sites will run a site-specific shopper agent by Cyber Week. Contentsquare found AI-referred traffic converting at 1.3 percent, up 55 percent year over year, with traffic volume up 632 percent, making it the only channel in their dataset where conversion rose.
What it means practically. AI assistants do not browse your site the way a person or a traditional crawler does. They read structured data and product feeds. That reframes several things you probably treat as chores:
- Product feed quality is now a discovery channel: Accurate titles, complete specifications, live inventory, real pricing, and correct variant data determine whether an assistant can recommend you at all.
- Structured data is not optional: Product, Offer, AggregateRating, and FAQ schema give answer engines something unambiguous to quote.
- Review content matters more, not less: Salesforce found 41 percent of shoppers saying a brand-owned AI assistant answering their questions made them much more confident, to the point of replacing the need to read reviews. The models still need review text to generate those answers.
- Your pricing is being scraped: Salesforce explicitly includes competitor scrapers fuelling algorithmic price-matching in its AI traffic forecast. Assume your BFCM pricing is visible to competitors in near real time and plan accordingly.
The honest caveat. AI referral traffic is growing fast from a small base. It does not yet justify reallocating your budget away from channels that work. It does justify spending two weeks in October cleaning your feed and schema, because that work has a long tail and costs comparatively little.
Where AppMaker Fits: The Owned Mobile Channel
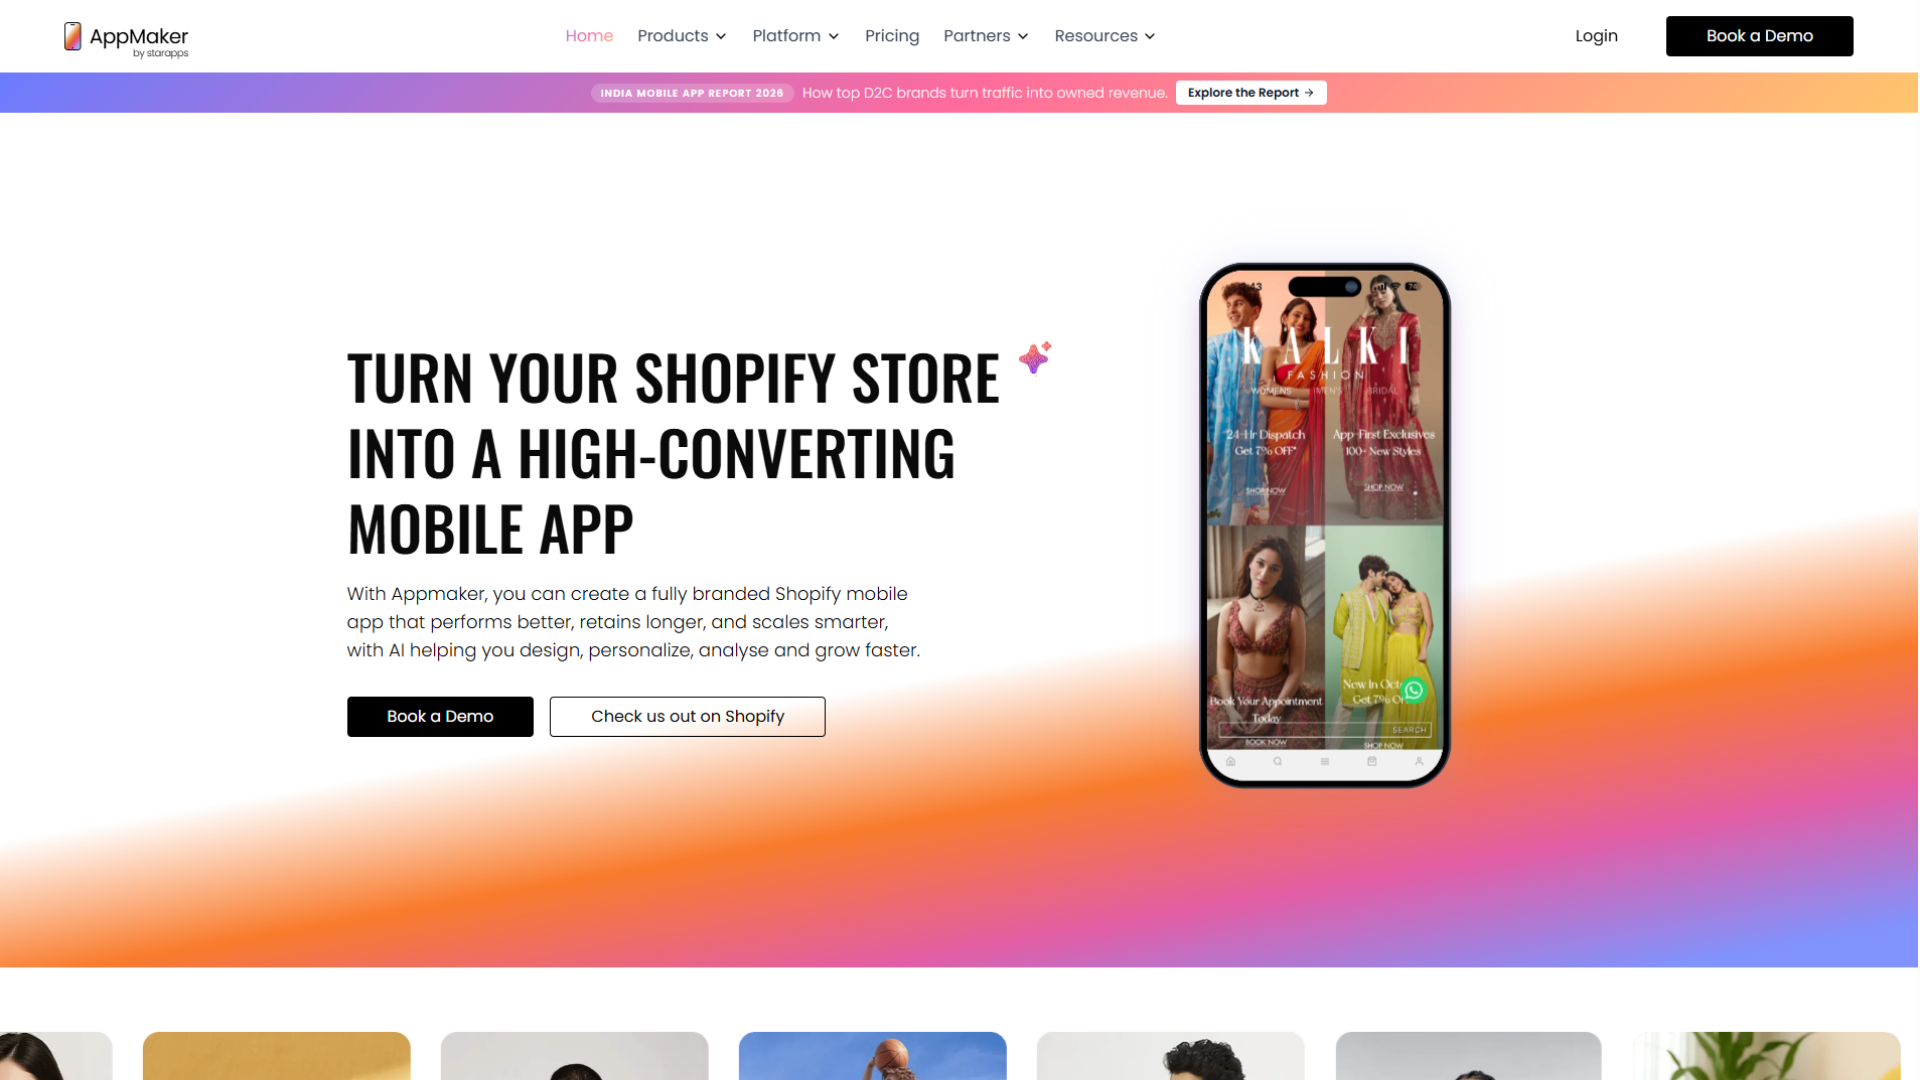
Direct answer: A branded app gives you reach you do not have to rent. Push lands on installed users in seconds at effectively zero marginal cost, on the device where 70 percent of Cyber Week 2025 orders were placed. Saved payment details, persistent carts, and cached assets remove the friction keeping mobile web below desktop conversion. The value compounds across the 53 percent of holiday shopping that happens after Cyber Monday.
Rented reach versus owned reach
Sort every channel by one question: when demand peaks, does your cost to reach one more customer go up?
| Channel | Cost of one more message at peak | What degrades during Cyber Week |
|---|---|---|
| Paid search and social | Rises with competition | CPMs inflate when you need volume most |
| Marketplace or social shop | Commission per order | You do not own the relationship |
| Near zero | Promotions tab at its annual worst | |
| SMS | Per-message fee | Cost and opt-out risk both climb |
| App push | Effectively zero | Fatigue, if you send unsegmented |
The first two rows are reach you rent, and the price rises in the week you need it most. That is the structural reason BFCM paid media gets less efficient every year. Push is the only row where cost and latency both hold through the peak. It is not free: you pay in install acquisition and in the discipline not to burn the opt-in. But you pay at October prices, and the asset does not expire on December 1.
The BFCM app playbook
An app treated as a second storefront adds little. An app treated as a sequencing tool changes the shape of the week.
| Window | The play |
|---|---|
| 10 to 6 weeks out | Convert existing mobile traffic into installs. Request push permission after a second session, never on first launch, because permission granted after value survives the season |
| 6 to 4 weeks out | Segment the base into never purchased, one-time, repeat, lapsed, and high AOV. Segmenting now is what lets you send four messages on Black Friday instead of one |
| 2 to 0 weeks out | Open app-only early access 12 to 24 hours ahead of the public offer. Exclusivity by timing costs no margin; exclusivity by discount costs it every year |
| Peak | Push at intent spikes: offer live, restock, price drop, final hours. Deep link every message. Recover carts at 30 to 60 minutes, ahead of email |
| Dec to Feb | Second-purchase prompts, replenishment triggers, one-tap reorder. This window decides whether BFCM acquired customers or sold inventory |
Cap frequency per user rather than per campaign, and hold a quiet-hours window. Revenue from a 2 am push rarely covers the opt-outs it triggers.
Modelling the return without fooling yourself
Most app business cases fail the same way: they credit the app with every order flowing through it. Most of that revenue is migrated, not created. Your best repeat customers install first, buy as they always would have, and the dashboard reports a transformative conversion rate.
Compare app installers against mobile web customers with similar prior purchase history over the same period. That gap is the only number worth putting in a business case. Model adoption as a share of returning mobile customers rather than total traffic, apply only the incremental delta on frequency and AOV, subtract platform fee, build, install acquisition, and ongoing merchandising, then express the answer as months to payback.
What AppMaker does, mapped to those jobs
| BFCM job | Capability |
|---|---|
| Change campaigns without a developer or a new build | AppMaker Studio, drag-and-drop blocks with live preview |
| Show different content to different segments | Conditional Blocks, driven by Shopify tags and metafields |
| Run behaviour-triggered push at peak volume | Push campaigns for cart, restock, price drop |
| Answer performance questions mid-weekend | Plus analytics for post-season cohort work |
Capabilities verified against AppMaker's Shopify App Store listing, which also covers real-time Shopify sync.
On results, weigh the source. The House of Rare reports over 2 million downloads and a 2.5x conversion rate, per AppMaker's case studies, and Supertails, writing on the Shopify App Store after a year on the platform, describes the app as opening a new revenue channel and doubling retention. AppMaker's own data across its top brands claims up to 4x conversions and 40 percent higher AOV. That is self-selected and vendor-reported. Treat it as a hypothesis for the cohort test above, not a benchmark.
When an app is the wrong answer
Skip it if your traffic is mostly desktop, if your purchase cycle runs in years, if repeat purchase sits under 10 percent and you have not diagnosed why, or if nobody owns merchandising. An app with a stale home screen is worse than no app, because it turns an engaged customer into an uninstall.
Skip it this season too if you are starting from nothing now. Store reviews add days, and a listing with no reviews converts installs poorly. Spend BFCM 2026 capturing install intent against traffic you are already buying, then launch ahead of the next peak with an audience waiting. How to build a mobile app MVP in 2026 covers that path.
Fulfilment, Shipping Promise, and Returns
Delivery is a conversion lever disguised as an operations problem. Twenty percent of fixable cart abandonment traces to slow delivery, and free shipping ranked as the single most important factor in where to shop across every income band in Salesforce's 2026 research.
Before the season:
- Confirm carrier capacity and cutoff dates in writing with your 3PL by early October, not by phone in November.
- Publish shipping cutoff dates prominently from mid-November. Ambiguity about arrival dates suppresses gift purchases more than price does.
- Decide your free shipping threshold and hold it. Moving it mid-event trains customers to wait for the better version.
- Model the shipping subsidy into your margin floor per SKU. Salesforce forecasts an additional $3 billion in global free shipping subsidy this season, which is a direct margin transfer from retailers to carriers.
During and after:
- Set delivery expectations conservatively and beat them. A promise missed during gifting season costs a customer, not just an order.
- Make returns exchange-first rather than refund-first. Store credit and exchanges preserve revenue and the relationship.
- Staff for the post-Christmas returns spike. Adobe found returns rising 4.7 percent between December 26 and 31, with about one in seven seasonal returns landing in that window.
- Keep the returns experience on the channel customers use for it. Only 38.8 percent of returns happened on mobile in 2025 against 56.4 percent of spend, so your returns portal needs to work properly on desktop and in email.
Customer Support and Fraud Readiness
Two operational risks reliably surface during peak, and neither gets enough planning attention.
Support volume scales faster than orders: Order-status questions, discount-code failures, and delivery anxiety compound. Prepare by writing macros in October for the ten questions you know are coming, publishing a visible shipping-cutoff and order-status page, and pre-booking support coverage for the Saturday and Sunday between Black Friday and Cyber Monday when most teams are thin. Salesforce reported agentic customer service conversations growing 55 percent week over week during Cyber Week 2025, with agent-handled actions such as address changes and return initiations up 70 percent, which is a signal that automating the top few repetitive requests genuinely relieves pressure.
Fraud rises with volume and urgency: Review your fraud rules before the event, not during it, because an over-tight rule set during peak rejects good orders at the worst possible moment, and a loose one produces chargebacks in January. Pay particular attention to cross-border orders, which Shopify reported at 16 percent of all BFCM 2025 orders, and to gift-shipping patterns where billing and delivery addresses legitimately differ.
Retention, Loyalty, and Repeat Purchases
Here is the structural problem with BFCM: it reliably attracts the least loyal customers available. Discount-seeking buyers repeat at lower rates than full-price buyers, which is how a record Cyber Monday turns into a disappointing Q1 without anything obviously going wrong in between.
The fix has to be designed into the event rather than bolted on afterwards.
During the event:
- Capture more than an email address. A push token, phone number, size or preference data, and a stated category interest are all worth more in February than an email alone.
- Make loyalty enrolment part of checkout. Points earned on a discounted order still create a reason to return at full price.
- Seed the second purchase inside the first. A post-purchase offer valid from December 10 converts far better than a generic January win-back.
- Use the 53 percent. More than half of holiday shopping remained after Cyber Monday last year. Your post-purchase message on November 30 should assume the customer is still shopping.
After the event:
| Window | Objective | Primary tactic |
|---|---|---|
| Dec 1 to Dec 20 | Turn first-time buyers into second-time buyers | Post-purchase cross-sell, gift cards, shipping-cutoff urgency |
| Dec 21 to Jan 10 | Handle returns without losing the customer | Exchange-first returns, store credit incentives |
| Jan 11 to Feb 28 | Re-engage the BFCM cohort at full price | Replenishment triggers, loyalty tier progress, new-arrival access |
The metric that settles the argument: track your BFCM cohort's 90-day repeat purchase rate separately from your overall repeat rate. If it comes in below half your full-price cohort, you did not acquire customers. You sold inventory at a discount to people who will come back next November for exactly the same reason.
Deeper treatment in AppMaker's guides to customer retention apps for Shopify and improving customer loyalty with a Shopify mobile app.
Analytics: What to Instrument Before November
Build this in October. Nobody builds a dashboard on Black Friday.
The peak-week operating dashboard
| Metric | Why it matters during peak | Cadence |
|---|---|---|
| Revenue per session by device | Catches mobile-specific breakage faster than conversion rate alone | Hourly |
| Add-to-cart rate by collection | Diagnoses merchandising rather than traffic | Every 4 hours |
| Checkout completion rate | Earliest signal of a payment or form failure | Hourly |
| Payment error rate by provider | One gateway failing is invisible in aggregate numbers | Hourly |
| Discount depth as percent of gross | The margin guardrail | Daily |
| New versus returning revenue split | Tells you whether you bought sales or earned them | Daily |
| Inventory cover on top 20 SKUs | Prevents oversell and guides paid spend reallocation | Every 4 hours |
| Page load time on PDP and checkout | The lever with the widest downstream effect | Continuous alerting |
The post-season scorecard
Run this within two weeks of Cyber Monday while the data is clean and the team still remembers what happened.
- Contribution margin after discount, shipping subsidy, payment fees, and actual returns
- CAC by channel, calculated on incremental new customers rather than all orders
- Discount elasticity by SKU: which products needed the discount and which sold regardless
- Cohort quality: 30, 60, and 90-day repeat rate for BFCM buyers against your baseline
- Owned versus paid revenue split, with a clear read on how much came from audiences you already had
- Capacity learnings: what broke, what nearly broke, and what you switched off
A Note for D2C Brands Selling in India
Indian D2C brands face a different shape of peak season: a large festive window running from roughly September to late November, then BFCM, then end-of-year clearance. That is two peaks, with inventory and working capital stretched across both.
Redseer reported that the first 11 days of India's 2025 festive sale generated more than ₹60,000 crore in GMV, running at roughly 3.5 times business-as-usual levels and growing 20 to 22 percent year over year. Around 90 million shoppers participated in that window, with 60 to 65 percent coming from Tier 2 and smaller cities.
The strategic consequence for brands not selling through marketplaces is that owned channels matter more in India than almost anywhere else, because marketplace sale events dominate paid attention during the festive window. Brands that spent the pre-season months building email, WhatsApp, and push audiences enter the peak with reach that does not require outbidding Flipkart and Amazon on the same keywords. AppMaker's India Mobile App Report 2026 covers benchmarks for this market, and the marketing calendar maps the festive-to-BFCM sequence.
Twelve Mistakes That Cost D2C Brands Money During BFCM
- Starting in November. Inventory lead times and app store reviews make late decisions either expensive or impossible.
- Forecasting revenue instead of units and margin. Inflation flatters the top line while unit economics quietly deteriorate.
- Treating mobile as a smaller desktop. The device carrying 70 percent of orders deserves its own design and QA process.
- Deploying code during peak week. Freeze early. The upside of a late feature almost never covers the downside.
- Discounting uniformly. One percentage across every SKU destroys margin on products that would have sold anyway.
- Hiding shipping cost until checkout. The largest single fixable cause of abandonment in Baymard's data.
- Sending broadcasts and skipping flows. Flows convert at roughly 13 times campaign rates and run unattended.
- Forcing account creation. Eighteen percent of fixable abandonment traces straight to this.
- Ignoring product feed and schema quality. Increasingly, this determines whether AI assistants can recommend you at all.
- Moving the free shipping threshold mid-event. It teaches customers that waiting pays.
- Measuring the weekend and stopping. The cohort's 90-day behaviour determines whether the event was profitable.
- Capturing no owned-channel identity. A visitor who buys and leaves no reachable identity is a customer you have to buy again.
BFCM Glossary
BFCM. Black Friday Cyber Monday, the four-day or five-day peak shopping window running from Black Friday through Cyber Monday, often extended to include Thanksgiving.
Cyber Week. The five days from Thanksgiving through Cyber Monday. Note that measurement firms define it slightly differently, so compare like with like when benchmarking.
AOV. Average order value, total revenue divided by total orders.
Contribution margin. Revenue minus all variable costs including COGS, discount, shipping subsidy, payment fees, and expected returns. The number that determines whether BFCM was worth running.
Cart abandonment rate. The share of sessions where an item was added to cart without a completed purchase, calculated as one minus purchases divided by cart additions.
Flow versus campaign. A flow is a behaviour-triggered automated sequence. A campaign is a one-off broadcast send.
Direct open rate. The share of push notification recipients who open the app directly from the notification.
Agentic commerce. Purchases researched, recommended, or executed by AI agents acting on a shopper's behalf.
Hybrid sale. A purchase involving both digital research or tools and a physical store somewhere in the journey.
Frequently Asked Questions
When does BFCM 2026 start and end?
Thanksgiving falls on Thursday, November 26, 2026. Black Friday is Friday, November 27, and Cyber Monday is Monday, November 30. Cyber Week is generally measured as the five days from Thanksgiving through Cyber Monday. In practice, promotional activity now starts in early November and demand continues into mid-December.
When should a D2C brand start BFCM preparation?
Ten to twelve weeks before Black Friday. Inventory commitments and supplier lead times set the earliest deadline. Creative production, flow builds, and performance work belong in the six- to eight-week window. Code freeze and load testing go in the final two to four weeks. Anything needing app store review or a 3PL contract change has to be decided first.
How much should a D2C brand discount during BFCM?
Work backwards from a contribution margin floor per SKU after discount, shipping subsidy, payment fees, and expected return rate. For an external anchor, Adobe recorded peak 2025 discounts of 30.9 percent in electronics, 25.1 percent in apparel, and 18.8 percent in furniture. Then use structure rather than depth: tiered thresholds, bundles, gift with purchase, and early access all create urgency without requiring a bigger percentage.
What is the average cart abandonment rate and what can actually be fixed?
Baymard Institute's meta-analysis of 50 studies puts the documented average at 70.22 percent. About 42 percent of abandoners were simply browsing and are largely unrecoverable. Among the rest, the leading causes are extra costs at checkout (40 percent), slow delivery (20 percent), payment security concerns (19 percent), and forced account creation (18 percent). Most of those are design decisions rather than consumer behaviour.
Do mobile apps actually convert better than mobile web?
The independently verified picture is that mobile carries roughly 70 percent of traffic while converting well below desktop, per Contentsquare's 2026 benchmark across 99 billion sessions. Apps remove several specific causes of that gap: repeated logins, re-entered payment details, session loss, and slow asset loading. Published app-versus-web multiples vary widely by category and are often vendor-reported, so the honest answer is that apps address known causes of mobile friction and the size of the gain should be measured on your own cohort data.
Is it too late to launch a mobile app for BFCM 2026?
For most brands, yes, if you are starting from nothing in mid-September. App store review adds days, and a listing with no reviews or screenshots converts installs poorly. The better play is to treat this season as an audience-building event: capture install intent, grow your push and SMS lists, and launch ahead of the next peak with an audience already waiting.
How should push notifications be used during BFCM without triggering opt-outs?
Segment by behaviour rather than sending to the full base, cap frequency at the user level rather than the campaign level, deep link every message to the exact product or cart, and keep broadcast sends for genuinely time-bound moments such as the offer going live or the final hours. Behaviour-triggered messages such as restock, price drop, and cart abandonment carry the highest intent and the lowest opt-out risk.
What should the abandoned cart timing be during peak week?
Compress everything. First touch at 30 to 60 minutes rather than the usual one to four hours, second the same day, third before the offer expires. Lead with push for app users, follow with email, and reserve SMS for the highest-value carts. Avoid stacking an extra discount on top of a live BFCM offer.
How is AI changing BFCM ecommerce in 2026?
Adobe measured generative AI referral traffic to US retail sites up 693.4 percent during the 2025 season. Salesforce forecasts 20 percent of 2026 holiday ecommerce traffic originating from AI chat agents and predicts one in three ecommerce sites will run a site-specific shopper agent by Cyber Week. Practically, this makes structured, accurate, live product data a discovery requirement alongside traditional SEO, because agents read feeds rather than browsing pages.
Which channel drives the most BFCM revenue for D2C brands?
It varies by brand, but the reliable pattern is that owned lifecycle channels punch far above their send volume. Klaviyo found automated flows generating close to 41 percent of email revenue from 5.3 percent of sends. Paid media typically drives the most new-customer volume and the worst efficiency during peak week, when CPMs are highest.
What should D2C brands measure after BFCM?
Contribution margin after all discount and fulfilment costs, CAC on incremental new customers, discount elasticity by SKU, and 30, 60, and 90-day repeat purchase rates for the BFCM cohort compared with your full-price baseline. Weekend revenue on its own tells you almost nothing about whether the season was worth running.
How do you keep BFCM customers from being one-time discount buyers?
Capture more than an email at checkout, enrol buyers into loyalty during the purchase, and seed the second purchase inside the first with an offer valid in early December. Then measure the cohort separately. NRF found consumers still had 53 percent of their holiday shopping left after Cyber Monday, so the window for a second purchase opens immediately rather than in January.
Should a D2C brand run BFCM offers on marketplaces and social shops as well as its own site?
If your category has meaningful marketplace demand, yes, but keep your best offer and your earliest access on owned channels. Salesforce reports social shops holding at 7 to 9 percent of total orders for brands that run them and forecasts social commerce growing at nine times the rate of traditional ecommerce this season, so the channel is real. The risk is training customers to buy from a platform that owns the relationship.
What is the single highest-ROI BFCM preparation task?
For most D2C brands, it is mobile checkout. It sits at the intersection of the largest traffic source, the largest conversion gap, and the largest documented set of fixable abandonment causes. Cutting form fields, surfacing landed cost early, and adding express wallets typically costs less than one week of peak paid media and keeps paying afterwards.