






















Key Takeaways
- To increase average order value in your mobile app, grow basket size at a fixed order count, since AOV equals total revenue divided by total orders.
- AOV is one of three revenue levers (traffic, conversion rate, AOV), and a 10% AOV lift flows straight to revenue with no extra ad spend.
- Mobile apps out-earn the mobile web per order thanks to saved payment details, native personalisation and push, closing much of the device gap on their own.
- AI-powered product recommendations lift AOV by around 20%, making segment-aware personalisation one of the highest-return tactics for app sellers.
- Post-purchase upsells add roughly 10 to 15% incremental AOV at low cost, because friction is lowest right after a completed transaction.
- Free-shipping thresholds work best when set 10 to 20% above a region's baseline basket, paired with a visible progress bar in the cart.
- Never optimise AOV alone; track conversion rate, cart abandonment and customer lifetime value alongside it, or basket gains can quietly cost customers.
Every mobile commerce team eventually asks the same question: we have the traffic and the installs, so why isn't revenue growing at the same pace? More often than not, this isn't a traffic problem. It's an average order value (AOV) problem.
Getting a customer to open your app is hard. Getting them to check out is harder. Getting them to check out with a bigger cart, without feeling pushed, is where real mobile revenue is made. This guide walks through exactly how to do that, with data, tactics, and a framework you can put to work today.
What Average Order Value Really Means for a Mobile App
Average order value is the average amount a customer spends every time they complete a purchase. The formula sits at the heart of nearly every revenue conversation an app-based brand will have:
AOV = Total Revenue ÷ Total Number of Orders
If your app generated $500,000 last month from 4,000 completed orders, your AOV is $125. It sounds almost too simple to matter, but that single number is a diagnostic tool. It tells you whether your product mix is working, whether your pricing psychology is landing, and whether your app experience is nudging shoppers toward bigger baskets or letting them check out with the bare minimum.Here is why AOV deserves its own strategy rather than being treated as a byproduct of other metrics. Mobile revenue is the product of three variables multiplied together: traffic, conversion rate, and AOV. Most teams pour their entire budget into the first two, more ad spend for traffic and more conversion tests, while AOV sits untouched, quietly capping the ceiling on every dollar the other two levers generate. A 10% lift in AOV reaches the bottom line without a single additional install or ad dollar spent. That is the entire argument for reading the rest of this guide.There is also a second, less obvious reason AOV deserves dedicated attention inside an app specifically. Acquiring a mobile app install is often more expensive than acquiring a single web visit, because it requires clearing the higher-commitment hurdle of a download before a customer ever sees a product. That upfront cost means every app user carries a higher implied acquisition cost than a typical website visitor. If that user's basket size stays flat, the economics of running an app get harder to justify over time. If their basket size grows, the same acquisition spend pays back faster, and the entire app channel becomes more defensible internally, whether the conversation is with a CFO reviewing marketing spend or a growth team deciding where to allocate next quarter's budget. In that sense, AOV isn't just a revenue lever. It is the metric that determines whether an app investment pays for itself.
Why Mobile Apps See Lower AOV Than Desktop, and Why That Is Changing
It is tempting to assume mobile shoppers simply spend less because they are impulsive or distracted. The real story is more structural, and more fixable. Across Dynamic Yield's cross-category benchmark, desktop AOV sits around $192 while mobile trails at $133, a gap of roughly $59 per order that shows up across most industry studies.
Three structural reasons explain most of that gap:
- Screen real estate limits basket-building: On a laptop, a shopper can compare five products side by side. On a phone screen, they are lucky to see one and a half. Bundles and cross-sells that would be obvious on desktop simply never surface on mobile unless a brand deliberately designs for it.
- High-ticket, considered purchases still skew desktop: Shoppers researching a $1,200 sofa or a $400 camera tend to finish that research, and that purchase, on a bigger screen, even if the browsing started on a phone.
- Mobile web, not mobile app, drags the average down: This is the detail most benchmark reports bury. When mobile is broken into "mobile web" versus "mobile app", the app consistently wins.
This last point matters most for anyone building or investing in a branded shopping app. Average order values tend to be higher in mobile apps than on mobile websites, driven by smoother checkout flows, saved payment credentials, and personalisation that a browser tab cannot replicate. In other words, the "mobile problem" in most AOV reports is really a "mobile web problem". A well-built app closes a meaningful share of that device gap on its own, before a single AOV tactic is switched on.
The App Advantage, Quantified
| Factor | Mobile Web | Mobile App |
|---|---|---|
| Checkout friction | Higher (manual entry, redirects) | Lower (saved cards, biometric checkout) |
| Personalisation depth | Limited to session or cookie data | Full purchase history, behaviour, preferences |
| Repeat engagement | Requires a return visit via link or search | Push notifications drive direct re-entry |
| Session length | Under a minute on average | Several minutes per session |
| Loyalty integration | Fragmented across visits | Persistent login, points and tiers |
This table is the reason so many D2C brands invest in a dedicated app rather than betting everything on a responsive mobile site. The infrastructure for higher AOV is baked into the app format itself. The tactics below simply build on top of that foundation.
The Real Cost of Ignoring AOV
Before diving into tactics, it is worth sitting with what a stagnant AOV actually costs a growing app. Imagine two D2C brands, both spending the same amount on paid acquisition, both converting at the same 2.8% rate. Brand A has an AOV of $65. Brand B has optimised theirs to $85 through bundling and post-purchase offers. On 10,000 monthly sessions, that $20 difference in AOV alone adds up to tens of thousands of dollars in additional monthly revenue, without either brand spending an extra cent on ads or improving their conversion rate by a single point.
This is the compounding nature of AOV. Because it multiplies against every existing order rather than requiring new customers, it is one of the few growth levers with almost no acquisition cost attached. A brand that ignores it isn't just leaving money on the table. It is paying full acquisition cost for revenue it could have generated for free.
Personalisation: The Highest-Leverage Lever in Your App
If one tactic shows up across nearly every AOV study, it is personalisation. AI-powered product recommendations can lift average order value by around 20%. Adobe reports that after one merchant activated product recommendations in Adobe Commerce, its AOV rose by 20%, and the number climbs further when personalisation goes beyond generic "customers also bought" widgets into genuinely segment-aware recommendations.
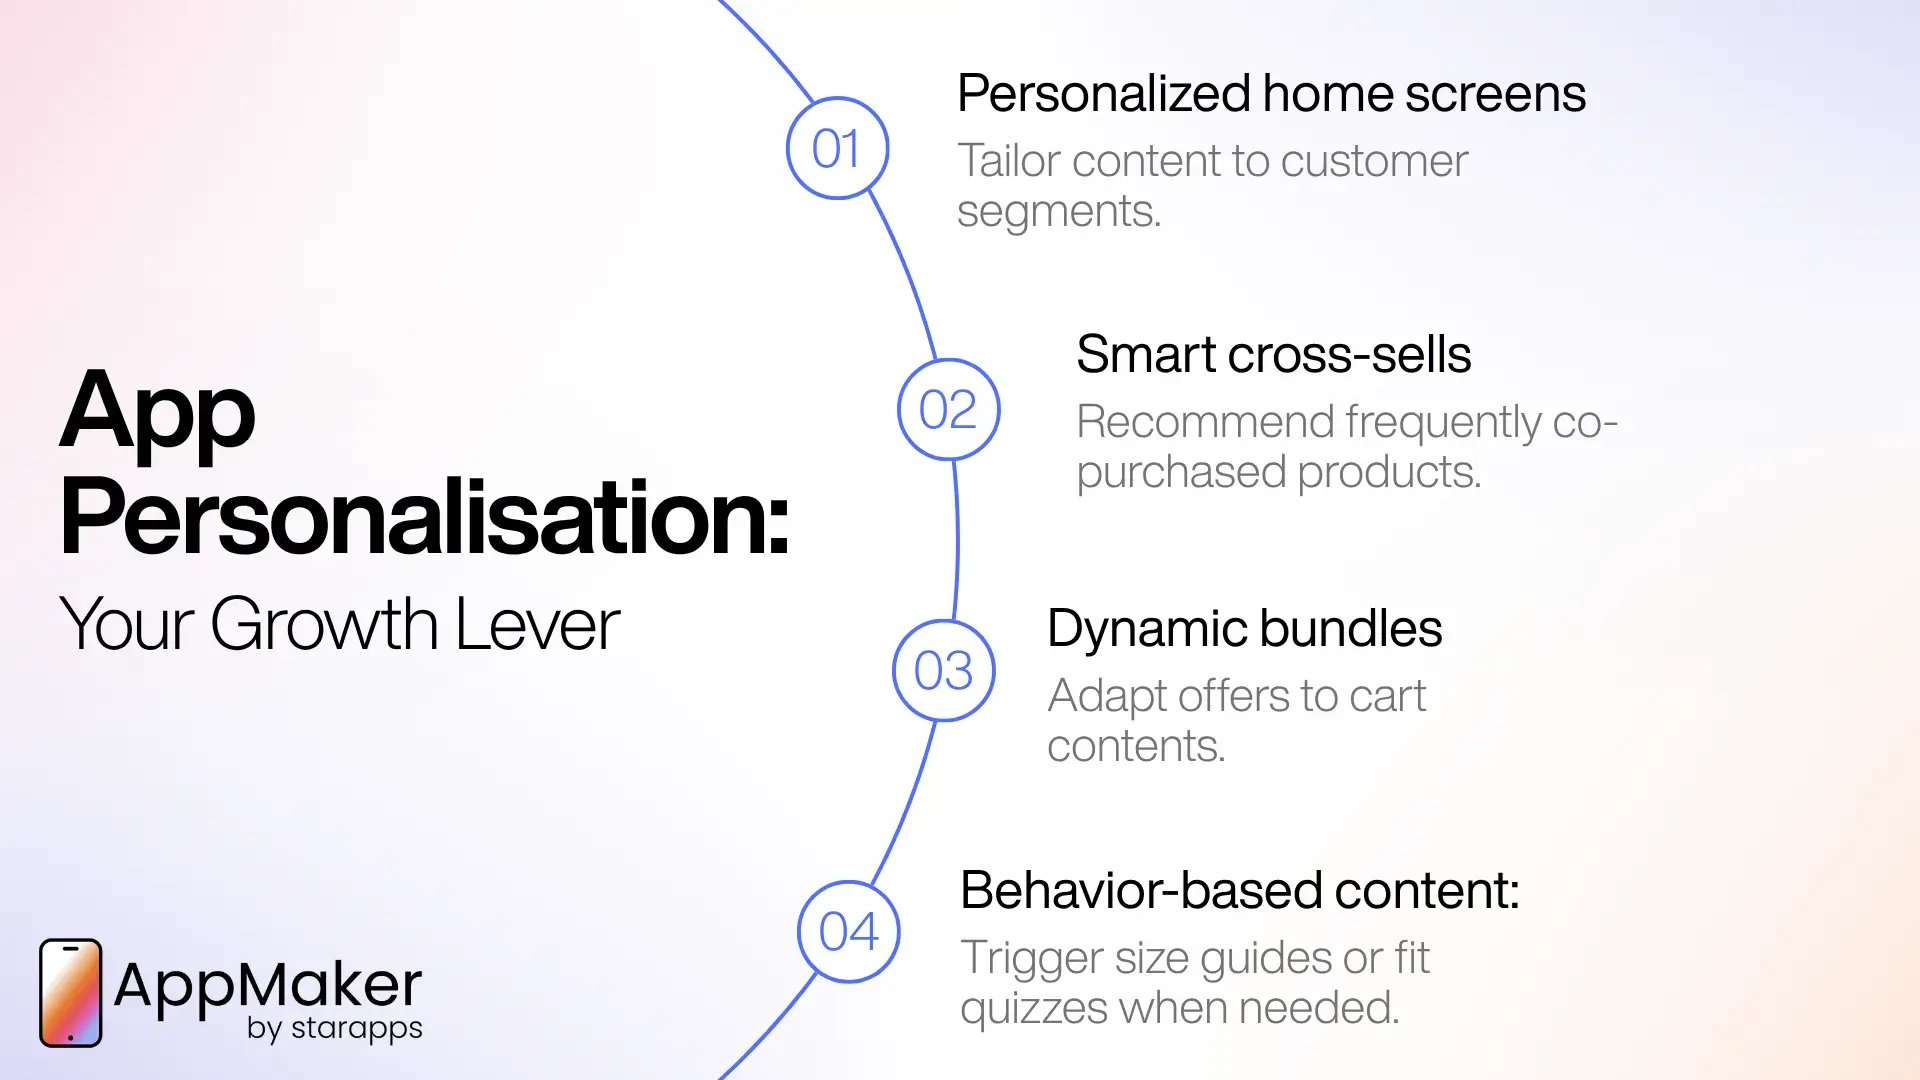
Inside an app, this kind of segment-awareness is typically powered by conditional content blocks, logic that changes what a shopper sees based on their tags, order history, or behaviour, rather than showing every visitor an identical storefront.
Personalisation outperforms almost every other tactic on this list for one reason: it doesn't ask the shopper to do anything different. No popup, no discount code, no extra decision point. It simply shows the right product at the right moment, based on data the app already has.
- Home screen modules that shift by segment. A first-time visitor sees bestsellers and trust signals. A repeat customer sees "back in stock" items from categories they have already purchased.
- Product page cross-sells based on co-purchase data, not just category tags, recommending items statistically bought together rather than items that merely share a collection page.
- Dynamic bundling suggestions that adjust to the cart, rather than a static "frequently bought together" block that never changes.
- Behaviour-triggered content blocks, such as surfacing a size guide or fit quiz to a shopper who has bounced off the same product page twice without adding to cart.
Generic recommendation widgets offer only modest gains on their own. The real lift comes from personalisation tailored to segment behaviour, with logic that changes per customer tag or action rather than showing every shopper the same static layout. That distinction separates apps that treat personalisation as a checkbox from apps that treat it as infrastructure.
Bundling: Turning "One Item" Into "One Purchase Occasion"
Bundling is the practice of grouping two or more products into a single purchase, priced to encourage a bigger basket than buying each item separately. It is arguably the oldest AOV tactic in retail, and it remains one of the most effective because it reframes the purchase decision entirely. Instead of asking "do I want this one thing", bundling asks "do I want this complete solution", a subtly different question that tends to produce a higher-value yes.
The impact is well documented. Across industry benchmarks, well-designed bundles lift AOV by roughly 20 to 35%, with the strongest implementations reaching higher still, particularly in categories like skincare, pet food, and electronics where products are naturally used together.
Bundle Types Worth Testing in an App
- Fixed bundles: a pre-set combination (skincare routine, starter kit) sold at a single price point. Simple to merchandise, easy to feature on a home screen banner.
- Mix-and-match bundles: "pick any 3 for $45", which give shoppers a sense of control while still anchoring them to a bigger basket than a single-item purchase.
- Volume bundles: "buy 3, get 1 free", which work particularly well for consumables and beauty categories where repeat usage is a given.
- Add-on bundles at the cart level: a small, low-friction nudge like "complete the set for $12 more", positioned right before checkout rather than earlier in the funnel.
For high-ticket categories, cross-selling add-ons and protection plans lifts order value without heavy discounting, while lower-ticket categories tend to respond better to free-shipping thresholds and curated sets than to markdowns. Bundling strategy should follow the category, not a one-size-fits-all playbook.
Free-Shipping Thresholds That Actually Move Behaviour
A free-shipping threshold is a minimum spend a shopper must reach to unlock free delivery, used specifically to nudge basket size upward. Few tactics are as widely used, or as commonly miscalibrated. Set it too low, and you give away margin on orders that would have happened anyway. Set it too high, and shoppers abandon the tactic altogether rather than stretch their basket.
The fix is regional and behavioural, not universal. Customers respond to thresholds that sit just above their market's typical basket size, encouraging them to add one more item without feeling forced into an artificial minimum. Regional AOV differences make a single global threshold a genuine liability. In one consolidated cross-category dataset, the Americas sits around $183, APAC around $135, and EMEA around $128, meaning a $150 threshold that feels reasonable in the United States can feel unreachable in parts of APAC and trivially easy in parts of EMEA.
How to Set a Threshold That Works
- Calculate your current AOV by region or segment, not just as a single global number.
- Set the threshold 10 to 20% above that baseline, close enough to feel achievable, far enough to require a genuine add.
- Surface progress visually inside the cart. A progress bar showing "$8 away from free shipping" consistently outperforms a static banner, because it turns the threshold into a mini-goal rather than a rule.
- Re-evaluate quarterly. As AOV shifts with seasonality and product mix, a threshold set in January can go stale by the time a spring collection launches.
Upselling and Cross-Selling: Timing Is Everything
Upselling and cross-selling are often lumped together, but they solve different problems. An upsell offers a better version of what is already in the cart: a larger size, a premium finish. A cross-sell offers something complementary: a case for the phone someone just bought, a conditioner to match the shampoo. Both work, but only when the timing respects the shopper's decision-making state.
Where Upsells and Cross-Sells Belong in the Journey
- Product page: a relevant upgrade ("add the extended warranty") shown once, not stacked with three competing offers that dilute attention.
- Cart page: complementary items based on what is already added, the highest-intent moment for a cross-sell, since the shopper has already committed to buying something.
- Post-purchase, immediately after checkout: the most underused moment in most mobile apps, and arguably the most effective. A shopper who has just completed a purchase is in a moment of confirmed intent, not comparison-shopping mode.
Post-purchase offers like "add this for 15% off" immediately after checkout are statistically cheaper to execute than acquiring a new customer, and they can add roughly 10 to 15% incremental AOV. The mechanism is simple: friction is at its lowest point right after a completed transaction, because payment details are already saved and the shopper has already crossed the psychological threshold of buying.
One caution worth building into any upsell strategy: aggressive tactics like "Buy 3, Get 1 Free" can spike AOV in the short term but train shoppers to delay purchases until the next promotion, or erode margin if used too often. The healthiest upsell programmes feel like a natural extension of the purchase, not a negotiation.
Push Notifications: The App's Unfair Advantage Over Web
This is where a native app pulls decisively ahead of a mobile website, because push notifications don't exist in the browser-tab world in the same way. The data on their impact on spending is striking. In Leanplum's analysis of more than 56 million mobile marketing activities, promotional push notifications drove 9.6 times as many users to make a purchase as sending no message at all, and lifted in-app spending by roughly 16%.
Timing compounds the effect. In the same analysis, notifications sent on a Saturday generated 2.2 times more purchases than those sent on a Thursday, and promotions sent in the late afternoon led to 2.7 times more purchases than other times of day. This level of granularity simply isn't available to brands relying on email alone, where send-time optimisation operates on a much blunter scale. Treat these figures as directional evidence that timing and channel matter, then validate the specific windows against your own audience rather than assuming they transfer unchanged.
Push Use Cases That Support AOV, Not Just Retention
- Cart-recovery pushes with a bundling nudge: instead of a plain reminder, include a complementary item alongside the abandoned product.
- Threshold nudges: "You're $8 away from free shipping", sent while a session is still active rather than as a generic promotional blast.
- Restock and back-in-stock alerts tied to past purchases, which tend to convert at a premium because they target proven demand.
- Segment-based flash offers, sent only to high-value or high-frequency segments, avoiding the fatigue that comes from blasting every user with every promotion.
This channel only works if opt-in rates are healthy in the first place. A well-timed "soft ask", explaining the value of notifications before the native permission prompt appears, consistently produces stronger long-term opt-in rates than requesting permission the moment the app opens. That is a design decision as much as a marketing one, and it is exactly the kind of native capability that separates a fully built app from a repackaged mobile website.
Loyalty Programmes: Turning Repeat Purchases Into Bigger Ones
Loyalty programmes are usually framed as a retention tool, but their effect on AOV is just as significant and far less discussed. A points-based system that rewards spending tiers ("spend $100, unlock free shipping for a year") gives shoppers a reason to add one more item to reach a threshold they actually want to hit, rather than one imposed on them by the brand.
Loyalty Mechanics That Influence Basket Size
- Tiered spending thresholds that unlock better perks at higher basket values, encouraging shoppers to stretch toward the next tier rather than settle for the minimum.
- Points multipliers on bundles or specific categories, nudging shoppers toward higher-margin products without a blunt discount.
- Early access to new drops for members, which increases both frequency and basket size since early releases often carry full-price premiums.
- Birthday and milestone rewards redeemable only above a minimum spend, converting an emotional touchpoint into a basket-building moment.
Loyalty and rewards integrations are increasingly built directly into app infrastructure rather than bolted on as a separate widget, allowing a customer's loyalty state to inform everything else: the personalisation they see, the bundles offered to them and the push notifications they receive.
Dynamic Pricing and Smart Discounting
Discounting is the fastest way to move AOV in the wrong direction if it isn't done with intent. A flat 20%-off-everything promotion can shrink AOV, because it reduces the revenue on each order without requiring a shopper to add anything. The fix is to discount in a way that specifically rewards bigger baskets.
Discounting Approaches That Protect and Grow AOV
- Spend-based discount tiers: "$10 off $75, $25 off $150", rather than a flat percentage off everything. This explicitly rewards crossing a threshold.
- Dynamic pricing based on segment and season, adjusting incentives for high-value customers differently than for first-time browsers.
- Discounting the bundle, not the individual item, so the incentive only applies when a shopper adds multiple products rather than cherry-picking one discounted item.
- Time-boxed offers tied to basket value, such as a 24-hour "unlock a free gift at $80" promotion that creates urgency around a spend target rather than a single SKU.
Every discount decision comes back to the same question: does this incentive reward a bigger basket, or does it simply subsidise a purchase that was going to happen anyway? Only the former protects and grows AOV over time.
Checkout Experience: Where Baskets Are Won or Lost
Every tactic above can build a bigger cart, but a clunky checkout will happily let a shopper abandon half of it before paying. According to the Baymard Institute, the documented average cart abandonment rate across 50 studies is 70.22%, and mobile runs higher than desktop, with most 2026 datasets placing mobile web abandonment in the high 70s to low 80s against desktop in the mid-to-high 60s. Notably, native app abandonment tends to run far lower than mobile web in the same datasets, which is precisely the friction a purpose-built app checkout is designed to remove. A meaningful share of the mobile gap has nothing to do with price and everything to do with UX.
Checkout Design Choices That Preserve Basket Size
- One-tap payment options (saved cards, digital wallets) reduce the chance a shopper reconsiders their cart mid-checkout.
- Visible order summaries with edit access, so a shopper can adjust quantities without abandoning the flow and starting over.
- Sticky cart bars that persist across product pages, keeping the running total visible and making "just $8 more to free shipping" prompts easy to notice without navigating away.
- Guest checkout with optional account creation after purchase, removing a barrier that has nothing to do with basket size but everything to do with whether the basket ever reaches payment.
A shopper who has already added a bundle, accepted an upsell, and hit a free-shipping threshold has done all the hard work an AOV strategy asks of them. Losing that basket to a slow or confusing checkout wastes every tactic that came before it.
Trust signals matter more at this stage than most teams assume, particularly once a basket has grown larger than usual. A shopper checking out with a $40 single item rarely pauses to reconsider, but a shopper checking out with a $140 bundle is far more likely to hesitate, scroll back up, or second-guess the purchase. Small reassurances placed near the payment button, a visible return policy, an estimated delivery date, or a security badge do more work at this exact moment than anywhere earlier in the funnel, precisely because the stakes of the decision have grown alongside the basket. Skipping this detail is one of the quieter ways an otherwise well-designed AOV strategy underperforms at the very last step.
Measuring AOV the Right Way
Optimising AOV without watching its neighbouring metrics is how brands accidentally damage their business while technically hitting their target. Real-time analytics that track performance from install through checkout make this kind of cross-metric monitoring possible without stitching together data from multiple disconnected tools. A rising AOV number in isolation can hide a shrinking customer base, a rising abandonment rate, or a discount strategy that is quietly eating margin.
The Metrics That Should Move Alongside AOV
| Metric | Why It Matters | Warning Sign |
|---|---|---|
| Conversion rate | Confirms AOV tactics aren't scaring shoppers away | AOV rises while conversion falls sharply |
| Revenue per visitor | Combines conversion and AOV into one true growth signal | RPV flat despite AOV growth |
| Cart abandonment rate | Flags friction introduced by new upsell or bundle prompts | Abandonment spikes after a new tactic launches |
| Customer lifetime value | Tracks whether AOV gains are healthy long term or discount-driven | Tracks whether AOV gains are healthy long term or discount-driven |
Segment the data before concluding anything. Breaking AOV down by first-time versus returning customers, by acquisition channel and by campaign reveals patterns a single blended number hides completely. Email subscribers who already trust a brand tend to buy with a higher basket value, while paid social traffic frequently converts at a lower AOV because those shoppers are earlier in their consideration journey. Treating both segments identically wastes the more targeted tactics described above. Free-shipping thresholds, bundle depth, and loyalty-tier design should all flex by segment rather than applying uniformly.
The healthiest cadence is weekly or monthly trend-watching rather than reacting to single-day swings, since AOV is naturally noisy at a daily level and can be skewed heavily by a handful of large orders.
Common Mistakes That Quietly Undermine AOV Efforts
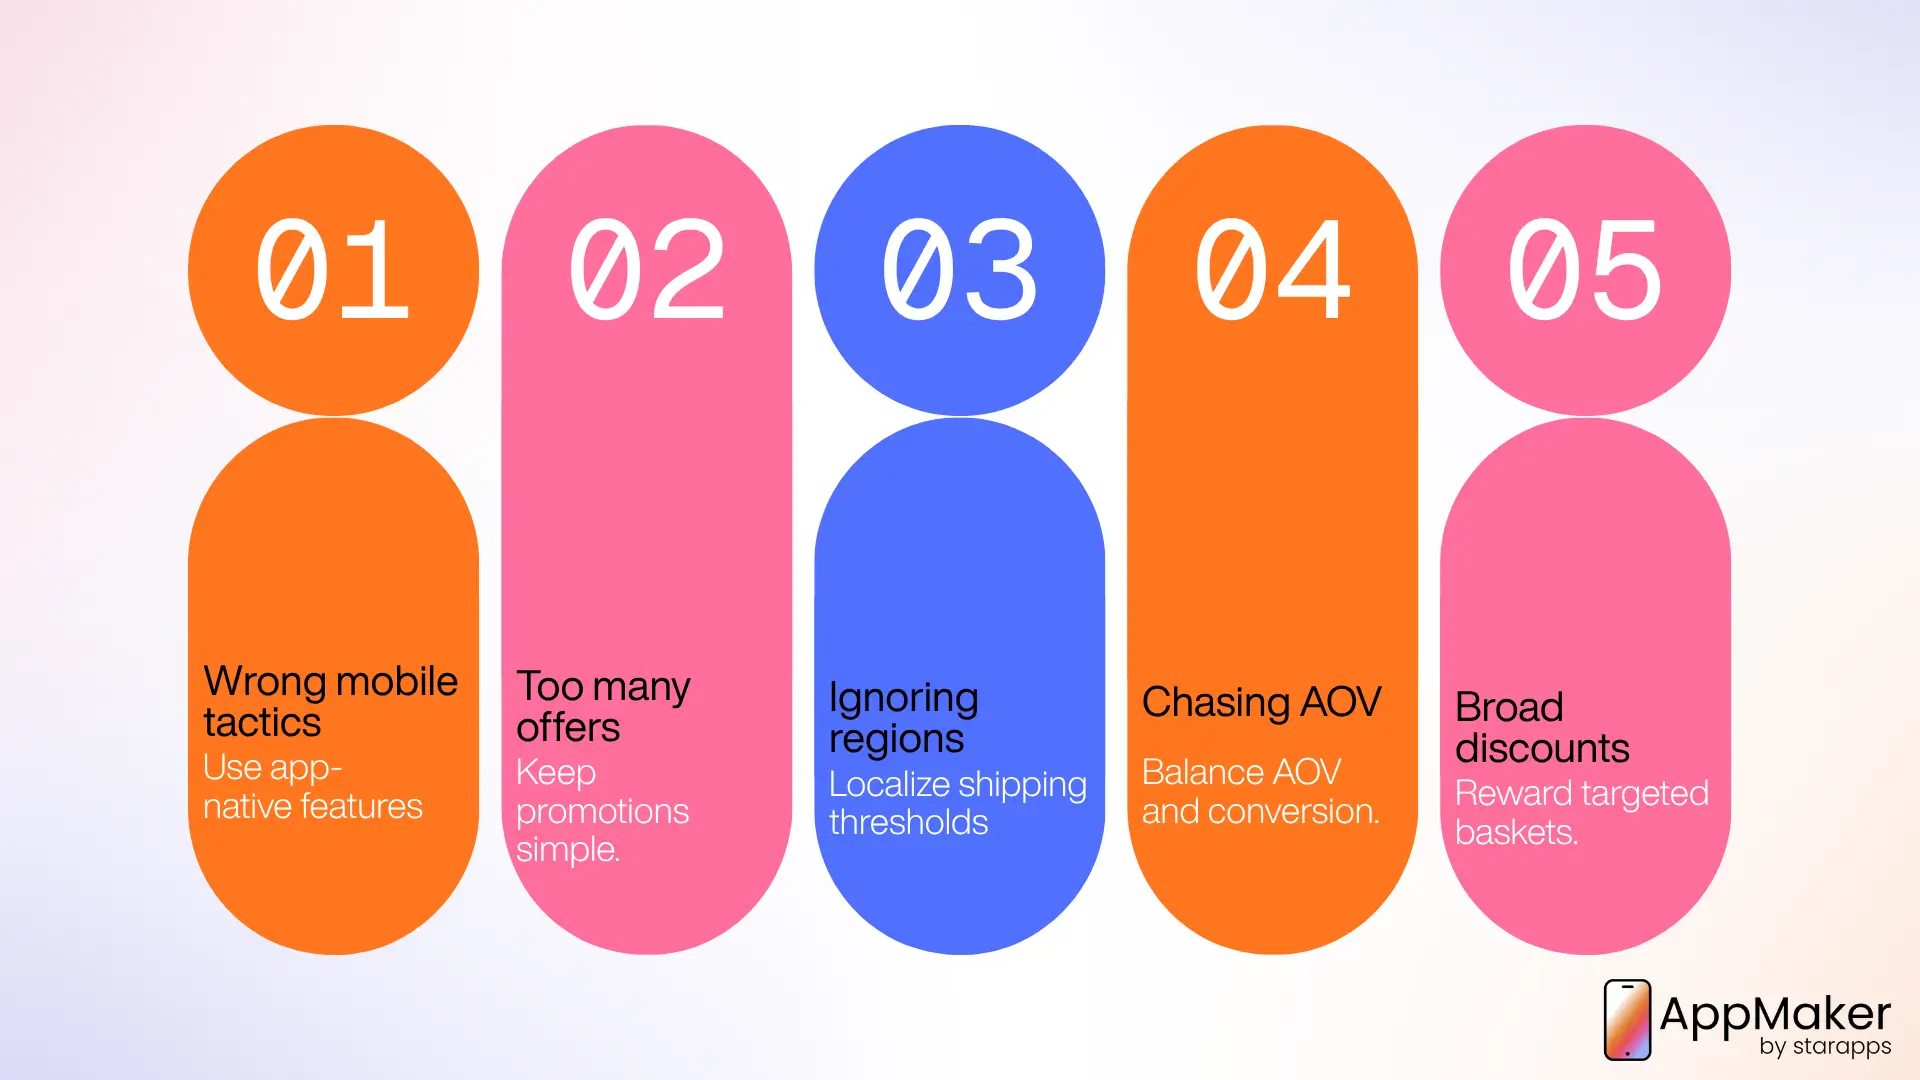
Even well-intentioned AOV programmes fail in predictable ways. Recognising these patterns early saves months of misdirected effort.
- Treating mobile web tactics as mobile app tactics: A banner that works on a responsive site often gets buried in an app's navigation. App-native surfaces (home screen tiles, push, in-app messaging) need their own design thinking, not a copy-paste from the web experience.
- Stacking too many prompts at once: A product page with an upsell banner, a bundle carousel, and a countdown timer all competing for attention typically converts worse than a single, well-placed offer.
- Ignoring regional basket differences: A single global free-shipping threshold can simultaneously be too generous in one region and unreachable in another.
- Chasing AOV at the expense of conversion: A 15% AOV increase paired with a 20% conversion drop is a net loss, not a win, a trap that is easy to fall into when AOV is tracked without its companion metrics.
- Discounting broadly instead of rewarding baskets specifically: Flat, sitewide discounts move volume but frequently shrink true AOV once the maths is done correctly.
Building an AOV Roadmap: Where to Start
With this many levers available, the natural question is sequencing. A practical rollout order, based on effort versus impact, looks like this:
- Week 1 to 2: Audit current AOV by segment, channel, and region. Set a realistic free-shipping threshold per region rather than a single global number.
- Week 3 to 4: Launch a post-purchase upsell flow. This is the lowest-friction, highest-return tactic on this list and requires no changes to the pre-checkout experience.
- Month 2: Introduce cart-level bundling and a visible progress bar toward the free-shipping threshold.
- Month 3: Layer in behaviour-based push notifications for cart recovery and threshold nudges, testing send windows against your own audience rather than assuming a universal best time.
- Month 4 onward: Build out true personalisation (segment-aware home screens, purchase-history-driven recommendations and loyalty-tier-based offers), since this layer benefits most from the data collected in the earlier phases.
This sequencing matters because personalisation and loyalty programmes are data-hungry. They perform far better once a brand has a few months of behavioural data from simpler tactics like bundling and post-purchase upsells already in motion.
How the Right App Infrastructure Makes This Easier
Nearly every tactic in this guide depends on one underlying requirement: an app built to support conditional logic, real-time data and native engagement channels, not a templated storefront replica. A drag-and-drop CMS that lets marketing teams launch banners, bundles and personalised content blocks without waiting on developer cycles is the difference between testing an AOV tactic in an afternoon and waiting weeks for an engineering sprint. Without that flexibility, most of the strategies above stay theoretical, always the next sprint's task, never this week's test.
Why Appmaker Is Built for This
This guide has covered personalisation, bundling, push notifications, loyalty and checkout design as separate tactics, but on Appmaker they all run through one connected system rather than a patchwork of plugins. Appmaker is a mobile app builder purpose-built for Shopify D2C brands that treat their app as a long-term revenue channel rather than a mobile-web replica. A few specifics worth knowing:
- Studio CMS with a block-based builder: marketing teams launch banners, scrollers, timed content, and bundle layouts directly, without waiting on a developer to ship changes.
- Conditional Blocks: the conditional content engine changes what a shopper sees based on customer tags, purchase history, or metafields- the exact personalisation mechanic behind the roughly 20% AOV lift covered earlier.
- Enterprise-grade push campaigns: native push notifications support cart-recovery, threshold nudges and segment-based flash offers, managed from the same dashboard as the rest of the app.
- Extensions marketplace: sticky carts, countdown timers, reorder scrollers and loyalty modules are available as plug-and-play features rather than custom builds, so testing a new AOV tactic doesn't require a development cycle.
- Eidolon AI: turns a screenshot or Figma file into a ready-to-use, on-brand layout, shortening the time between deciding to test a merchandising idea and shipping it.
- Deep analytics: performance is tracked from install through checkout, so AOV gains can be verified against real funnel data rather than assumed from a single tactic launch.
Bringing It All Together
Raising average order value in a mobile app isn't about a single trick. It is about compounding small, well-timed nudges across the entire shopping journey. Personalisation shows the right product before a shopper even has to ask. Bundling reframes a single purchase into a complete solution. Free-shipping thresholds turn a policy into a mini-goal. Post-purchase upsells capture value in the highest-intent moment of the journey. Push notifications bring shoppers back with an offer, not just a reminder. And a smooth checkout makes sure none of that hard-won basket gets abandoned at the finish line.
None of these tactics work in isolation, and none work forever without measurement. The brands that win at AOV treat it as a system, tracked alongside conversion rate, abandonment, and lifetime value, rather than a number to chase in a vacuum. Built on the right app infrastructure, that system becomes far easier to run, test and improve month over month.
Frequently Asked Questions
What is a good average order value for a mobile app?
There is no single universal benchmark, since AOV varies heavily by industry and region. Luxury and jewellery categories average well over $300, while beauty and personal care sit closer to $90. The more useful benchmark is your own historical AOV by segment and channel, tracked over time, rather than an industry-wide number that may not reflect your product mix.
Why is mobile app AOV usually higher than mobile website AOV?
Mobile apps benefit from saved payment credentials, native personalisation, and push notifications that a browser-based mobile site cannot replicate, all of which reduce friction and support higher-value carts than the mobile web experience.
How quickly can a brand expect AOV to improve after implementing these tactics?
Post-purchase upsells and free-shipping threshold adjustments typically show measurable impact within a few weeks, since they require no behavioural data to work. Personalisation and loyalty-based tactics take longer, often two to three months, because they depend on accumulated purchase history to perform well.
Does increasing AOV always mean the business is growing healthily?
Not necessarily. AOV should always be tracked alongside conversion rate, cart abandonment, and customer lifetime value. A rising AOV paired with a falling conversion rate or shrinking repeat-purchase rate can signal that upsell tactics have become too aggressive.
What is the difference between upselling and cross-selling in a mobile app?
An upsell offers a better or larger version of an item already in the cart, such as a premium size or an extended warranty. A cross-sell offers a complementary item, such as a matching accessory. Both raise basket size but work through different psychological triggers and are typically placed at different points in the journey.
Should free-shipping thresholds be the same across all regions?
No. Regional basket sizes differ significantly, and a single global threshold tends to feel unreachable in lower-AOV regions while being trivially easy to hit in higher-AOV regions. Thresholds set roughly 10 to 20% above a region's baseline AOV tend to perform best.
Can discounting hurt average order value?
Yes, if discounts are applied broadly rather than tied to basket size. A flat sitewide discount can increase order volume while shrinking true AOV, since it doesn't reward customers for adding more to their cart. Spend-based discount tiers and bundle-specific offers are generally safer for AOV health.
What role do push notifications play in increasing AOV specifically, rather than just retention?
Beyond bringing users back to the app, well-timed promotional push notifications can directly increase in-app spending. Leanplum's analysis found a roughly 16% lift in spending and up to 9.6 times more purchases compared with sending no message at all. Cart-recovery pushes that include a bundling suggestion, rather than a plain reminder, extend this effect specifically to basket size.
Is personalisation worth the investment for smaller D2C brands, not just large enterprises?
Yes, particularly because AI-powered recommendation tools have become far more accessible, and the reported average AOV lift of around 20% applies broadly rather than only to enterprise-scale catalogues. Smaller brands can start with simpler segment-based personalisation, such as different home screen content for first-time versus returning shoppers, before investing in more advanced behavioural targeting.
What is the single highest-leverage tactic to start with for a brand new to AOV optimisation?
Post-purchase upsells are generally the best starting point, since they require no changes to the existing pre-checkout funnel, carry minimal risk of hurting conversion rate, and can add a meaningful 10 to 15% incremental AOV soon after launch.