
























Key Takeaways
- In the native Shopify app vs. mobile website debate, Poq's same-brand data shows apps convert 1.8x better at the median, not 3x.
- Mobile web converts at roughly 2%, and desktop converts 74% higher, across Contentsquare's 2026 benchmark of 99 billion sessions.
- Tapcart's analysis of 330 million Shopify orders links app launches to a 21.13% average revenue lift, ranging from 9.82% to 23.97% by vertical.
- App adopters spent 37% more but returned 41% more by value in a peer-reviewed study, so model net margin, not gross revenue.
- Poq's median app install rate was 2.5% of mobile web sessions, so the app's higher conversion rate applies to a small audience.
- Shopify apps usually embed the same checkout through Checkout Kit, so the app's edge comes earlier: shoppers arrive signed in with carts saved.
- iPhone web push needs a Home Screen install; with iOS at 60.68% of US mobile page views, native push matters most for US brands.
Across the 6,500+ websites in Contentsquare's 2026 benchmark, about 70% of visits came from mobile devices, and those visits converted well below desktop. App builders pitch a native app as the fix, usually with a "3x higher conversion" claim attached.
The better-controlled evidence gives a smaller and more useful answer. Apps do convert better for the same brand, but the gain comes mostly from repeat customers; it ranges from no lift to 4.2x depending on the brand, and some of it comes back as returns.
This guide covers the conversion, order value, retention, and revenue data, explains why the gap exists, shows where the mobile website still wins, and gives you a break-even formula to test an app against your own numbers. Sources are linked throughout, and vendor data is labelled as vendor data.
Native Shopify App vs Mobile Website at a Glance
| Mobile website | Native Shopify app | |
|---|---|---|
| Who it reaches | Every visitor. It is where search, social, and ad clicks land. | Only shoppers who install it. Poq's median install rate was 2.5% of mobile web sessions, from 0.2% to 6.1% by brand. |
| Conversion rate | About 2% on average (Contentsquare) | 1.8x the same brand's mobile web rate at the median (Poq) |
| Average order value | Baseline | Higher for 80% of brands, median +9% (Poq) |
| Checkout | Shopify checkout. Shop Pay was used on 32% of BFCM 2025 orders. | Usually the same Shopify checkout, embedded through Checkout Kit and reached already signed-in |
| Re-engagement | Email, SMS, and browser push. On iPhone, web push works only for Home Screen web apps. | Native push after opt-in. About 51% of ecommerce app users on iOS opt in (Pushwoosh). |
| Platform commission on sales | None | None on physical goods under Apple's and Google's rules |
| Fixed cost | Part of your Shopify store | Builder or development cost, plus Apple's $99 yearly developer fee and Google Play's $25 one-time fee |
| Time to go live | Immediate | Store review. Apple says 90% of submissions are reviewed in under 24 hours on average. |
What Counts as a Native Shopify App?
The term gets used loosely, and a lot of confusion comes from comparing different things.
Native Shopify app: An iOS and Android app installed from the App Store or Google Play that pulls your catalogue, customer accounts, and cart from Shopify. It renders with the phone's own interface components, keeps shoppers signed in, and can use push notifications and biometric sign-in. Checkout usually runs through Shopify's Checkout Kit, an open-source SDK for Swift, Android, and React Native that presents "the same checkout that buyers see on the web," including Shop Pay and Apple Pay.
Mobile website: Your Shopify storefront in a mobile browser, whether it runs on a theme or a headless front end.
Progressive web app (PWA): A mobile site with offline caching that shoppers can add to their Home Screen. Apple added web push in iOS 16.4, but only for web apps added to the Home Screen, and the permission prompt must follow a direct tap.
Website wrapper: An app shell that loads your mobile site. It gets an icon and push, but shoppers still see web pages. It also runs into Apple's guideline 4.2, which says an app should "elevate it beyond a repackaged website." The studies in this article cover native apps, so check which kind of app any benchmark describes before you apply it.
Keep one distinction in mind throughout: a mobile website serves everyone who arrives, while an app serves only people who chose to install it. Poq describes app users as "a self-selected, high-intent cohort." That difference in audience is the main reason app numbers look flattering, and it is why methodology matters more than any headline multiple.
Do Native Shopify Apps Convert Better Than Mobile Websites?
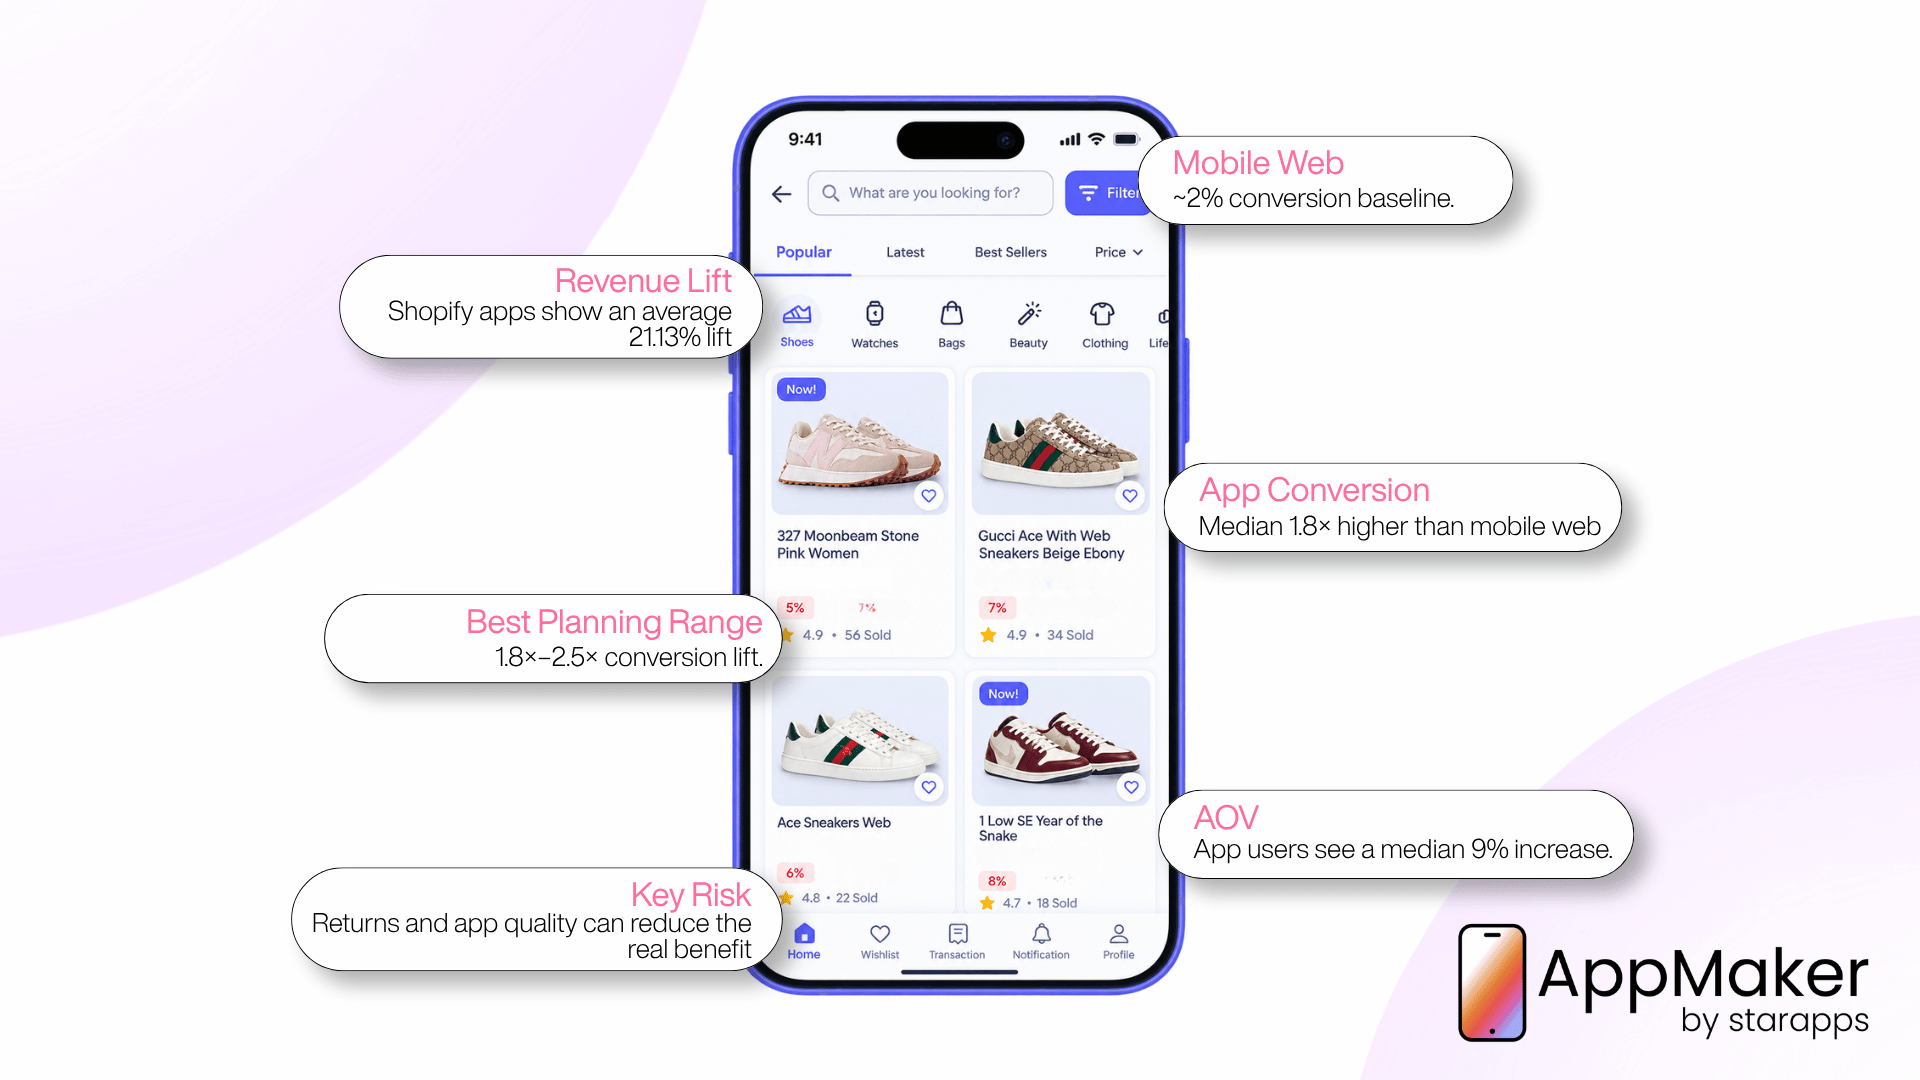
Yes, for the same brand, by about 1.8x at the median. The detail behind that number matters more than the number.
The mobile web baseline: about 2%
Contentsquare's 2026 Digital Experience Benchmark covers 99 billion web and app sessions across more than 6,500 websites in nine industries, comparing Q4 2024 with Q4 2025. Desktop converts at 3.4%, which Contentsquare says is 74% higher than mobile web. That puts mobile web at roughly 2%. Desktop drew 30% of visits but 47% of time spent.
Speed alone does not explain the gap. Slow page loads (over three seconds) fell 20% year over year and now affect just under 11% of sessions, yet mobile still converts well below desktop.
Same brand, same period: a 1.8x median
Poq sells a native app platform to enterprise retailers, so read its data with that interest in mind. Even so, its May 2026 comparison is the most carefully controlled dataset we found: 21 brands with app and mobile web analytics for the same period, across the UK, US, Europe and Australia and more than 15 retail sectors. It uses sessions as the denominator on both sides, compares each brand against itself, and reports in local currency.
| Sector | Region | App conversion | Mobile web conversion | Lift |
|---|---|---|---|---|
| Footwear | UK | 11.55% | 2.74% | 4.2x |
| Family lifestyle | UK | 4.92% | 1.51% | 3.3x |
| Loyalty and value retail | UK | 10.56% | 3.50% | 3.0x |
| Speciality outdoor | EU | 3.30% | 1.34% | 2.5x |
| Premium fashion | US | 3.61% | 1.56% | 2.3x |
| Beauty and cosmetics | US | 2.08% | 1.00% | 2.1x |
| Homewares and lifestyle | UK | 6.00% | 3.27% | 1.8x |
| Luxury fashion | UK | 2.14% | 1.48% | 1.4x |
| Premium denim | US | 1.80% | 1.32% | 1.4x |
| Value fashion | UK | 2.03% | 1.82% | 1.1x |
| Niche fashion | UK | 4.71% | 4.67% | 1.0x |
Selected rows from Poq's 21-brand dataset. Median lift: 1.8x. Twenty brands converted better in the app, and one was at parity.
Look at the spread before the median. Only 3 of the 21 brands reached 3x. Seven reached 2x or more, thirteen reached 1.5x or more, and four landed at 1.2x or below. A business case built on 3x is a bet on roughly a one-in-seven outcome.
Poq also found that 80% of brands had a higher average order value in the app, with a median increase of 9%, and that app users generated 1.5x more revenue per session. The biggest AOV gains came in premium lifestyle (+19%), premium footwear (+17%), and US premium fashion (+16%). Low-price, high-frequency categories gained through conversion rather than basket size.
Then there is adoption, which most business cases skip. Poq's median install rate was 2.5% of mobile web sessions, ranging from 0.2% to 6.1% by brand. The app's conversion rate only applies to shoppers who install it, so getting existing customers to download the app is part of the work. AppMaker's guide to marketing a Shopify mobile app covers the promotion side.
Shopify merchants: a 21.13% average revenue lift
The largest Shopify-specific dataset is Tapcart's Incrementality Index: 330 million orders, 120 million shoppers and $31.5 billion in revenue from its Shopify merchants, measured through 30 April 2025. Tapcart is an app builder analysing its own customers, so this is vendor data.
Launching the app channel was associated with an average total revenue lift of 21.13%. That figure blends conversion, order value, and purchase frequency, which makes it closer to what a finance team wants to know than a conversion multiple is.
| Vertical | Average total revenue lift |
|---|---|
| Fashion and apparel | +23.97% |
| Beauty and cosmetics | +21.31% |
| Food and beverage | +16.36% |
| Home and hobby | +11.66% |
| Health and wellness | +9.82% |
Source: Tapcart, Shopify merchants on platform versions before v20, through April 2025. Tapcart notes that subscription-driven revenue may understate the food and beverage and health and wellness figures.
Two more findings from the same data answer the cannibalisation question. Shoppers who started on the web and later adopted the app raised their total spend per shopper by about 36%, even as some of their orders moved from web to app. And 11.2% of customers were app-first, placing their first-ever order with the brand inside the app.
Flip that around and roughly 89% of customers made their first purchase outside the app, which tells you where acquisition still happens.
Where the "apps convert 3x better" claim comes from
The 3x claim traces to Criteo's Q1 2018 Global Commerce Review, which found that in North America, shopping apps converted more than three times better than mobile web. There are three problems with quoting it today:
- Different denominator: Criteo's US report defines conversion as "buyers/product page viewers," which gave apps 20% and mobile web 6%. Counting only product page viewers leaves out homepage bounces and browse-only visits, and app users tend to reach product pages with intent.
- Regional scope: The figure covers North America, not the world.
- Age: The data is from 2018. Mobile checkout has changed a lot since then: on Shopify, Shop Pay handled 32% of BFCM 2025 orders.
Poq's mid-tier brands cluster between 1.8x and 2.5x, and according to Poq, Tapcart's own same-brand figure has come down from 3.2x to 2.3x. A planning range of 1.8x to 2.5x fits the better-controlled evidence. Plan on the low end and treat anything above it as upside.
What peer-reviewed research says about app adoption
Vendor datasets describe apps that are already working. Academic studies test the effect more carefully, and they complicate the picture in useful ways.
| Study | Setting | Finding | What it means for a Shopify brand |
|---|---|---|---|
| Narang and Shankar, Marketing Science, 2019 | A large retailer's app launch, difference-in-differences design | Adopters bought 33% more often, bought 34% more items, and spent 37% more. They also returned 41% more by dollar value. Net spend rose 36% | The lift holds up under a stronger test, but returns rose slightly faster than purchases. |
| Gu and Kannan, Journal of Marketing Research, 2021 | A hotel group's app | App adoption significantly reduced overall spending, because adopters also installed rival apps and shopped around more | In categories where shoppers compare brands, an app can make comparison easier. The effect shrank for customers who used functional features rather than just browsing. |
| Zhang, Wang and Cao, Journal of Retailing and Consumer Services, 2024 | A Chinese ecommerce company | Apps drove more cross-category sales than mobile websites, but did less for direct sales of the product itself | Apps may be better at widening baskets than at closing a single-product sale |
| Shi, Lee, Kalyanam and Wedel, Journal of Marketing, 2025 | App crash field data plus experiments | One crash cut that session short, and the extra browsing in the next session did not make up the loss. Repeated crashes reduced engagement. | App quality carries its own risk. A buggy app can undo the channel's advantage. |
Narang and Shankar also found that app adopters bought more in physical stores as well as online. Shoppers who purchased within 48 hours of using the app often used it near the store and for loyalty rewards, product details, and notifications.
For a brand in apparel, footwear, or anything with sizing, the returns finding matters most. Build return rates into the business case instead of assuming gross revenue lift turns into margin.
Why Shopify Apps Convert Better: Five Mechanisms
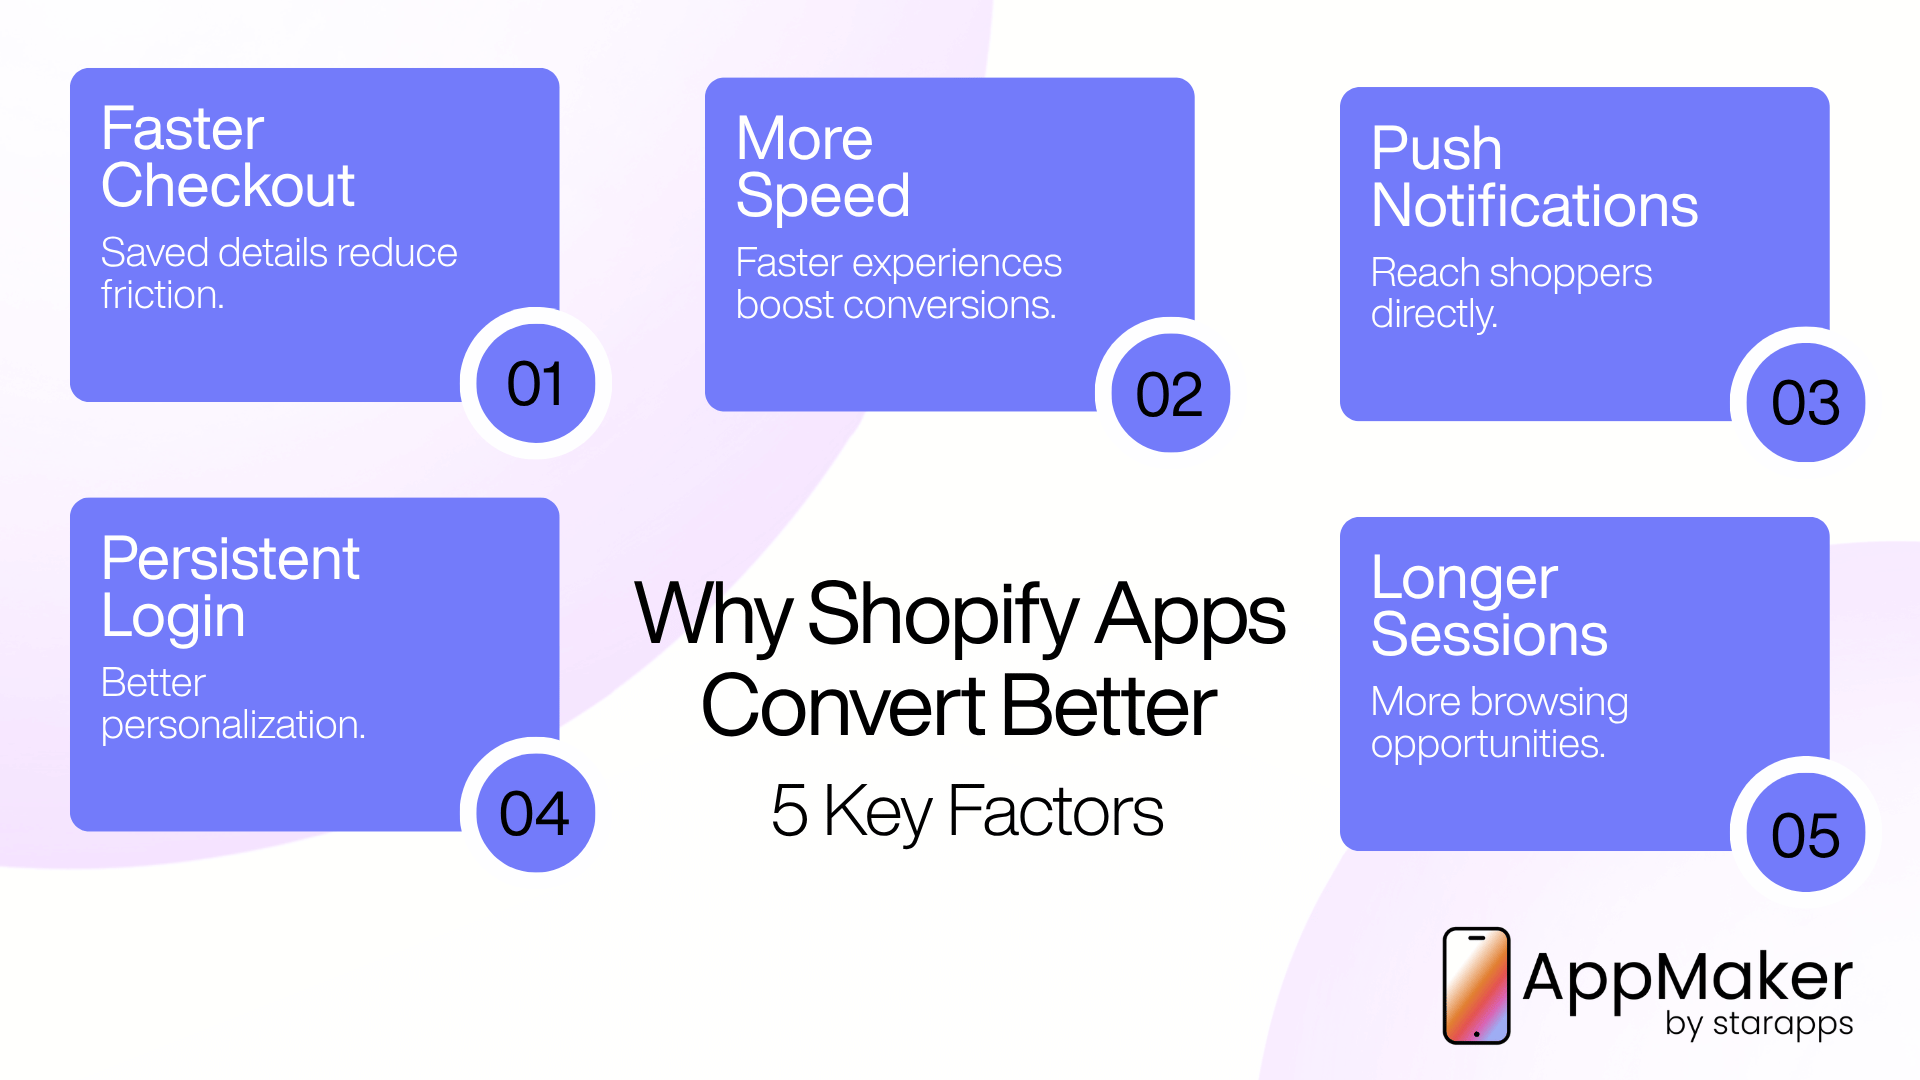
1. Shoppers arrive at checkout already signed in
App users sign in once. Their cart, addresses, and saved payment details are waiting the next time they open the app.
On Shopify, the checkout itself is usually not different. Checkout Kit embeds the standard Shopify checkout, with the store's payment methods and extensions. The app's advantage sits upstream: the shopper reaches checkout identified, with the cart intact, after tapping a home screen icon rather than following a link.
Baymard Institute's research, which averages 50 studies, puts cart abandonment at 70.22% and shows which kinds of friction an app can and cannot remove. Baymard found 42% of US shoppers have abandoned a cart because they were "just browsing." Among the other reasons:
| Reason for abandoning a cart | Share of US shoppers, excluding "just browsing" | Can a native app help? |
|---|---|---|
| Extra costs too high (shipping, tax, fees) | 40% | No. This is pricing and policy. |
| Delivery was too slow | 20% | No. This is logistics. |
| Didn't trust the site with card details | 19% | Partly. Saved payment means less re-entry. |
| Site wanted me to create an account | 18% | Yes. App users stay signed in. |
| Too long or complicated checkout | 17% | Partly. Saved details shorten it, but the checkout is often the same on both surfaces. |
| Website had errors or crashed | 17% | Partly. Apps crash too. |
| Couldn't see total cost up front | 12% | No. Fix this everywhere. |
Two of the three biggest reasons, extra costs and slow delivery, have nothing to do with having an app.
Shopify has also narrowed the gap on the web. Shop Pay was used on 32% of BFCM 2025 orders, and Shop Pay sales rose 39% year over year. Shopify reports that Shop Pay delivers as much as 50% better conversion than guest checkout, based on an April 2023 study with a large consulting firm. If your mobile site already runs accelerated checkout well, part of the friction an app would remove is already gone.
2. Speed still moves revenue
The Milliseconds Make Millions study, commissioned by Google and run by 55 and Deloitte, tracked 37 European and US brand sites across more than 30 million sessions for 30 days at the end of 2019. When four load metrics each improved by 0.1 seconds, retail conversions rose 8.4%, average order value rose 9.2%, and progression from product page to add-to-basket rose 9.1%. The study is correlational.
Plenty of mobile sites still have room to improve. The 2025 Web Almanac found that only 48% of mobile origins passed all three Core Web Vitals in July 2025, up from 44% a year earlier.
Poq lists performance among the app's structural advantages, noting that native apps load from device storage rather than over the network. In practice, the interface ships with the install while product data still loads over the network. The lesson cuts both ways: speed clearly matters, and much of the benefit is available on the mobile web without building an app.
3. Push notifications reach shoppers the web often cannot
Once a shopper opts in, native push lands on the lock screen without the per-message cost of SMS.
Current opt-in and engagement data comes from Pushwoosh's benchmark of more than 600 apps. For ecommerce and retail apps, iOS opt-in was slightly more than half (about 51%), Android opt-in was higher, and click-through rates were 3.78% on Android and 3.05% on iOS (Q4 2024 to Q2 2025).
Opt-in is no longer automatic on Android either. Since Android 13, notifications are off by default for new installs until the user grants permission, so when you ask now affects results on both platforms.
On retention, the largest public study is Airship's analysis of 63 million users across 1,500 apps. Users who received at least one push in their first 90 days retained at nearly three times the rate of those who received none. The data is from 2016 and correlational, since engaged shoppers are more likely to opt in, so read it as a direction rather than a forecast.
The technical gap is clearer. Web push is widely supported across browsers, but on iPhone it works only for web apps added to the Home Screen, which most Safari shoppers never do.
How much that matters depends on your market. StatCounter's August 2026 data puts iOS at 60.68% of US mobile page views and Android at 92.79% in India. For a US brand, push is one of the strongest reasons to build an app. In Android-heavy markets, the mobile site can already use browser push on most shoppers' phones, so the case for an app rests more on sign-in, checkout and loyalty.
Push works when you program it like merchandising, around restocks, drops, price changes and wishlist items, rather than sending on a fixed schedule. AppMaker's push notification strategy guide goes deeper on timing and targeting.
4. The shopper stays recognised
Inside your app, a signed-in shopper stays recognised from session to session, which gives personalisation a longer history to work with. On the web, Safari's Intelligent Tracking Prevention deletes cookies created in JavaScript and other script-writable storage after 7 days without user interaction. For shoppers who visit less than once a week, that wipes out browsing history the mobile site could otherwise use.
5. Sessions run longer
Contentsquare's 2024 benchmark, based on more than 43 billion sessions from 2023, found that app users spend 64% more time in the app than mobile web visitors spend on the site. A browser session competes with tabs, links, and the back button. An app session starts with a deliberate tap on an icon. More time in the app means more products seen.
Beyond Conversion: AOV, Retention and Lifetime Value
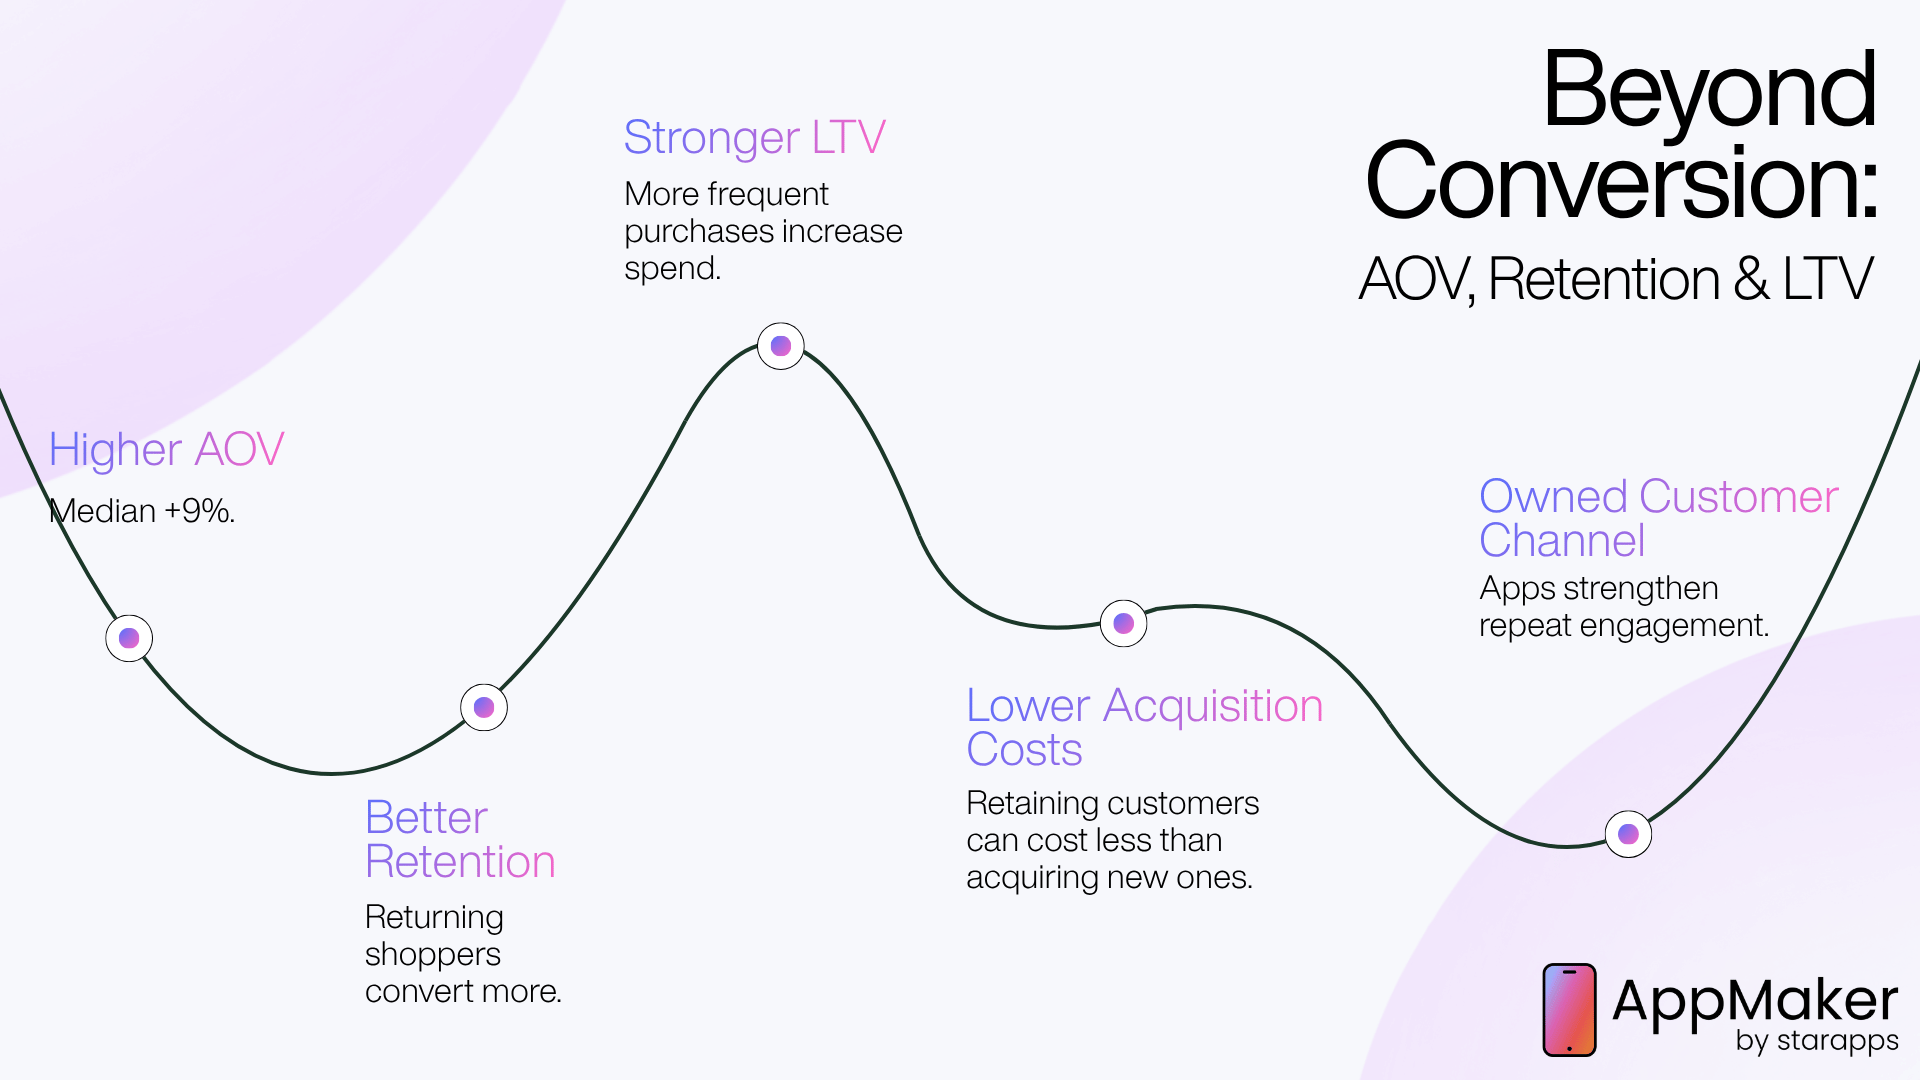
Average order value: Poq's same-brand median is +9%, with 80% of brands seeing some lift. Claims of 20% to 30% higher app AOV are common, but the controlled median is well below that.
Repeat customers: In Contentsquare's 2026 data, returning visitors made up 53% of visits and converted at 2.9%, against 1.7% for new visitors. Thirty-day retention on mobile rose 10% year over year while desktop retention fell 7%. Retention is where mobile is gaining, and it is what apps are built for.
App retention benchmarks, and a common mistake: Two published figures look contradictory:
- Adjust reports that ecommerce apps retained 18% of users on Day 1 and 5% on Day 30 globally in 2023, with Day 30 at 2.8% in North America and 4.2% in Europe.
- Poq reports month-one retention of 50% and month-12 retention of 20% across 19 of its brands.
They are not in conflict. Adjust measures for ecommerce apps broadly. Poq's sample is established brand apps with a self-selected, high-intent user base, and Poq does not publish its exact retention definition. Don't compare the two as if they measured the same thing.
Lifetime value: Narang and Shankar found 33% higher purchase frequency and 36% higher net spend, and Tapcart's web-to-app shoppers raised spend by about 36%. Frequency drives lifetime value, and a home screen icon plus push notifications is designed to increase it.
Acquisition costs: Contentsquare reports that the cost of a visit rose 9% year over year and 30% over three years, while 59% of sites saw traffic decline. When new visits cost more and convert less, keeping existing customers becomes the better investment. That is the strongest general argument for an owned app channel, and it rests on economics rather than interface design.
Evidence Scorecard: What Is Proven and What Is Not
Here is how strong the evidence is for each common claim about native apps versus mobile websites.
| Claim | Best evidence | Shopify-specific? | Confidence |
|---|---|---|---|
| Apps convert better than mobile web for the same brand | Poq, 21 brands, same period | No, multi-platform enterprise retail | High on direction. The multiple ranges from 1.0x to 4.2x. |
| Launching an app lifts total revenue | Tapcart, 330M orders | Yes, one vendor's merchants | Moderate. Observational vendor data. |
| App adopters buy more often and spend more | Narang and Shankar | No, one retailer | High for that setting. Causal design. |
| Returns rise with app adoption | Narang and Shankar | No | Moderate. Only one study measures it. |
| Apps don't cannibalise web revenue | Poq tracked 5 brands for 13 months; Tapcart cohorts | Partly | Moderate. Aggregate, not individual-level. |
| An app always increases spend | Gu and Kannan found the opposite for a hotel group | No | Low. Depends on the category. |
| Push improves retention | Airship, 63M users | No | Moderate on direction. The size is uncertain because the data is old and correlational. |
| iPhone web push needs a Home Screen install | WebKit | Platform fact | High |
| Apps convert 3x better | Criteo, 2018, North America | No | Low. Different denominator, dated. |
Two gaps remain across all of this research:
- No shopper-level proof of incrementality. No platform yet has the cross-platform identity data to prove it shopper by shopper, so every incrementality claim is observational.
- Little small-store data. Almost all published data comes from enterprise retailers and established DTC brands.
You will also see "70% of Shopify orders are mobile" or "79% of Shopify traffic is mobile." Neither figure appears in Shopify's own BFCM 2025 release, which gives no mobile share. Third-party figures run from about 50% to 79% and mix traffic share with order share. What Shopify does document is that merchants sold $14.6 billion over BFCM 2025, up 27% year over year, to more than 81 million customers, with an average cart of $114.70.
Where the Mobile Website Still Wins
An app works alongside your mobile site. It does not replace it, and several jobs belong to the site.
- Acquisition: In Tapcart's data, roughly 89% of customers made their first purchase outside the app. New customers find you through search, social, ads, and AI assistants, and most of those send them to web pages.
- Product page landings: Contentsquare found that one in three visits now starts on a product detail page, and nearly two-thirds of those landings bounce. Your mobile product pages carry first impressions whether or not you have an app.
- No install required: Most shoppers will never download your app, however good it is.
- Android-heavy markets: Where Android dominates, as in India, the mobile site can already use browser push, which narrows one of the app's biggest advantages.
In practice, the site acquires customers, and the app keeps them. Design the two to work together, with app prompts after a first purchase rather than before it.
Is a Shopify Mobile App Worth It? A Decision Framework
Step 1: Fix the mobile web issues first
The data ties these directly to lost orders, and none of them requires an app:
- Remove forced account creation (18% of US shoppers have abandoned a cart over it).
- Show shipping, tax, and the full total early.
- Turn on Shop Pay and other accelerated checkouts.
- Cut checkout fields. Baymard found the average US checkout shows 23.48 form elements, against an ideal of 12 to 14.
- Fix pages that take more than three seconds to load.
Baymard estimates that better checkout design alone can raise conversion by 35.26% for the average large ecommerce site. That is usually a cheaper and faster return than a second storefront.
Step 2: Check the fit
| Stronger case for an app | Weaker case for an app |
|---|---|
| Customers buy on a natural repeat cycle (beauty, pet, apparel basics, supplements, food) | Customers buy once or rarely |
| Returning customers already drive a large share of revenue | Most revenue comes from first-time buyers |
| Regular drops, restocks, or limited releases give push a real job | Nothing new to tell customers most weeks |
| A loyalty programme that can live in the app | No loyalty or membership mechanics |
| Paid acquisition costs keep rising | Slow mobile site or untouched checkout |
| Someone owns the app's merchandising calendar | Nobody has time to run another channel |
The last row matters more than it looks. Tapcart attributes where brands land within their vertical's range to execution: how clearly they give customers a reason to install, how widely they promote it, and how often they refresh the app.
Step 3: Run the breakeven
This formula estimates the annual online revenue you need before an app's fixed fees are covered by the extra contribution it generates:
Minimum annual online revenue = fixed yearly fees ÷ [(contribution margin × revenue lift) minus (revenue share × app share of sales × (1 + revenue lift))]
Two worked examples, both assuming $12,000 a year in fixed platform and developer-account fees, a 1% revenue share on in-app sales, and a 40% contribution margin:
| Scenario | Revenue lift assumed | App share of sales | Minimum annual online revenue |
|---|---|---|---|
| Cautious | 9.82% (Tapcart's lowest vertical average) | 20% | About $324,000 |
| Base | 21.13% (Tapcart's platform average) | 30% | About $148,000 |
In the base case, a store with $148,000 in annual online revenue gains about $31,300 in extra revenue. At a 40% margin, that yields roughly $12,500 in contribution, which covers the $12,000 in fees plus about $540 in revenue share.
The formula leaves out team time, install promotion, and design work, and the lift figures are associations measured on Tapcart's established merchants, not forecasts.
The practical lesson is that fees are rarely what decides the outcome. Adoption and execution do. When only a small share of mobile visitors ever install, a smaller store may not build an app audience large enough for any lift to register. Put in your own margin, fees, and expected lift before deciding.
Practical Questions Before You Build a Shopify App
Will Apple or Google take a cut of my sales?
Not for physical goods. Apple's guideline 3.1.3(e) requires apps selling physical goods to use payment methods other than in-app purchase, such as Apple Pay or card entry. Google Play's payments policy says its billing system must not be used for physical goods. Your normal payment processing fees still apply.
Whose developer account does the app live under?
Usually yours. Apple's guideline 4.2.6 says apps created from a commercial template or app generation service will be rejected unless submitted directly by the provider of the app's content. Budget for Apple's $99 yearly fee and Google Play's $25 one-time fee.
Can an app that wraps my website get rejected?
Yes. Guideline 4.2 asks for "features, content, and UI that elevate it beyond a repackaged website." That is one more reason to choose a native build over a website wrapper.
How do shoppers end up in the app instead of the website?
Through universal links. One URL works for both your site and your app. If the app is installed, the link opens it. If not, the link opens in the browser.
Apple notes that tapping a same-domain link while already browsing your site in Safari keeps the shopper in Safari. Set up universal links before launch so that links in emails and SMS messages send existing app users straight into the app.
When should I ask for push notification permission?
After the shopper has seen some value, not on first launch. On Android 13 and later, notifications stay off until the user agrees, and iOS asks for permission as well. With only about half of iOS shoppers opting in, the timing of that first request shapes the size of your push audience.
Do I still need my own app if my store is on the Shop app?
They do different jobs. Shopify describes Shop as a channel with 250M+ verified shoppers, where 48% of orders come from first-time buyers of a brand and there are no marketplace fees. Shop helps new customers discover you alongside other brands. Your own app puts your brand alone on the home screen and gives you a push audience that belongs to you.
Where AppMaker Fits
AppMaker is a Shopify mobile app builder. Both plans on its pricing page include native iOS and Android apps, Shopify sync for products, orders, and customers, unlimited push notifications, and analytics. Here is how that maps to what the evidence says drives results:
| What the evidence says matters | How AppMaker addresses it |
|---|---|
| Shoppers arriving signed in, with carts and details saved | Shopify customer and order sync inside a native app |
| Push as the retention channel the web lacks on iPhone | Unlimited push notifications with scheduled campaigns, automated triggers, and behavioural targeting |
| Execution and a steady merchandising rhythm | A block-based builder, conditional blocks for targeting segments, code blocks for custom flows, and pre-built extensions such as reorder scrollers and countdown timers |
| Your existing Shopify stack | 160+ integrations for loyalty, reviews, subscriptions, and marketing tools |
| Measuring your own multiple | Analytics covering revenue per session, conversion rate, AOV, and retention |
What AppMaker's case studies report
These results are self-reported by AppMaker and its merchants and have not been independently audited. The case studies do not publish measurement periods or how conversion was calculated.
| Brand | Category and market | Orders via app | App vs mobile web conversion | Other reported results |
|---|---|---|---|---|
| XYXX | Premium innerwear, India | Not published | 5.3x | 31% higher AOV and 7x ARPU vs online store; 60+ push campaigns a month |
| Supertails | Pet care, India | 67% | 2.5x | 2x higher repeat rate vs website users |
| Two Brothers Organic Farms | Organic FMCG, India | 50% | 3x | 56% add-to-cart rate after app open |
| The House of Rare | Premium fashion, India | 45% | 2.5x | 1.3x AOV vs website |
How to read these against the independent data:
- They sit at the top of the range: All four are at or above the top of Poq's 1.8x to 2.5x mid-tier range. Vendors publish their best results, so expect that from any case study library.
- They are repeat-purchase categories: Poq found its largest lifts where saved details speed up repeat orders.
- They are Android-heavy: All four operate in India, where Android holds about 93% of mobile page views, so their results likely rest more on sign-in, checkout, loyalty, and native push than on the iPhone web push gap.
Treat these numbers as the upper end of what is possible, and measure your own.
On cost, the Growth plan is $999 a month plus 1% of in-app sales. The Enterprise plan starts at $2,000 a month plus 1%, with one-time development fees (prices as listed in September 2026). Apple's and Google's developer fees are separate. Put those figures into the breakeven formula above with your own margin.
For more detail, AppMaker's India Mobile App Report 2026 covers app benchmarks for DTC brands, the case study library has the full write-ups behind the table above, the guide to what it costs to build a Shopify app compares custom builds with app builders, and this comparison of Shopify mobile app builders sets out the wider options.
How to Measure App vs Mobile Web Performance in Your Store
Don't borrow a benchmark. Measure your own the way the better studies do.
- Use sessions as the denominator on both sides: Not users, and not product page viewers. That one choice explains most of the variance between published figures.
- Compare the same period. Seasonality moves conversion more than channel does.
- Group customers by where they first bought, not by last touch. Build four cohorts: web only, web then app, app only, and app then web. Compare total spend per shopper across them.
- Measure six to twelve months before and after launch. One-month changes are noise.
- Track returns by channel. Given the Narang and Shankar finding, gross revenue lift only becomes margin once returns are netted out.
- Report the install rate and the share of first purchases made in the app. These tell you whether the channel will keep growing or stall.
- Check your mobile web baseline too. If the app converts at 2x a mobile web rate of 0.9%, the problem may be your mobile site.
For step-by-step retention tactics after launch, see AppMaker's guide to mobile app retention strategies.
Frequently Asked Questions
Does a native Shopify app convert better than a mobile website?
Yes, for the same brand. In Poq's same-period comparison of 21 retail brands, every app converted at or above the brand's mobile web rate, with a median lift of 1.8x. Results ranged from parity for a niche fashion brand to 4.2x for a UK footwear brand.
Where does the claim that apps convert 3x better come from?
From Criteo's 2018 Global Commerce Review. It covered North America only and defined conversion as buyers divided by product page viewers, not sessions, which inflates the app figure. Session-based, same-brand comparisons support a planning range of 1.8x to 2.5x.
How much extra revenue does a Shopify mobile app generate?
Across 330 million orders from its Shopify merchants, Tapcart linked app launches to a 21.13% average lift in total revenue. Fashion and apparel averaged 23.97%, and health and wellness averaged 9.82%. It is one vendor's observational data, so treat it as a planning range rather than a forecast.
Is a Shopify mobile app worth it for a small store?
Usually not as a first step. Published app data comes almost entirely from enterprise retailers and established DTC brands. Fixing forced account creation, hidden costs, slow pages, and long checkouts pays back faster, and the breakeven formula above shows how much revenue the app fees require.
What is a good conversion rate for a Shopify mobile app?
The useful comparison is your own mobile web rate for the same period. For context, Poq reports an app conversion rate of 2.84% across the 80+ retail apps on its platform from January 2025 to January 2026, and Contentsquare puts average mobile web conversion at about 2%. Neither figure is Shopify-specific.
Will an app cannibalise my website sales?
The aggregate evidence says no. Poq tracked five brands for 13 months and found mobile web revenue did not fall as app revenue grew, and Tapcart's web-to-app shoppers raised their total spend by about 36%. No platform can yet confirm this for individual shoppers.
Do app users spend more over time?
Generally, yes. Poq found a median 9% higher order value in the app for 80% of brands. A peer-reviewed study found app adopters bought 33% more often and spent 36% more net of returns, though their returns also rose, so measure margin, not just revenue.
How many of my customers will download the app?
Fewer than most plans assume. Poq's median install rate was 2.5% of mobile web sessions, ranging from 0.2% to 6.1% by brand. Tapcart links stronger results to giving shoppers a clear reason to install, such as early access or app-only perks, and promoting the app across every channel.
Should I launch on iOS or Android first?
Follow your customers. StatCounter puts iOS at 60.68% of US mobile page views and Android at 92.79% in India. Across Poq's platform, iOS produced 73% of EMEA and 85% of North American app revenue, and iOS users retained better than Android users at every milestone.
Can a progressive web app replace a native app?
Only partly. A PWA can add a home screen icon and offline caching, but on iPhone, web push works only after the shopper adds the site to the Home Screen, which few do. In Android-heavy markets, where browser push already works, a PWA covers more of the app's role.