


Mobile apps are becoming the go-to for shopping, browsing, and managing daily tasks. But as users depend on them more, performance can make or break their experience. A B2B website that loads in 1 second sees five times higher conversions than one that takes 10 seconds.
Slow startups, crashes, or laggy screens frustrate shoppers and hurt sales. Monitoring your app performance metrics is essential to spotting these issues early. Metrics like startup time, screen load, API response, and crash rate show where friction occurs and how to fix it.
In this blog, we’ll cover the top mobile app performance metrics every ecommerce brand must track, why they matter, and practical ways to improve app speed, responsiveness, and stability.
Overview
- Mobile app performance metrics measure speed, stability, responsiveness, and resource efficiency, directly impacting user experience and ecommerce conversion readiness.
- Tracking startup time, screen load, checkout speed, API latency, and UI responsiveness identifies friction points that block browsing, discovery, and purchase flows.
- Crash rate, error frequency, media rendering time, and frame drops reveal technical weaknesses that disrupt sessions and reduce engagement during high-intent shopping moments.
- Backend dependencies, catalog complexity, and personalization engines must be monitored to prevent slow updates, inventory mismatches, or delayed checkout experiences.
- Monitoring installs, session behavior, retention, and churn alongside performance metrics reveals where friction affects user loyalty and repeat purchase potential.
What Are Mobile App Performance Metrics?
Mobile app performance metrics are quantifiable indicators that measure how efficiently an app loads, responds, processes actions, and maintains stability across devices and network conditions. They evaluate startup speed, latency, crash frequency, rendering smoothness, and resource utilization to ensure consistent, friction-free user experiences. This directly impacts usability and conversion readiness.
To better understand what performance metrics capture, let’s compare them with behavioral metrics that are also often monitored.
Now that we’ve defined core performance metrics, let’s explore why they matter specifically for no-code ecommerce apps and dynamic storefronts.
Also Read: Push Notification Strategy: 9 Best Practices to Drive Engagement in 2026
Why Mobile App Performance Metrics Matter for No-Code Ecommerce Apps?
For no-code ecommerce apps, performance metrics validate how efficiently modular components, integrations, and real-time store sync operate under dynamic shopping conditions. Here are the reasons why these metrics matter:
- Impact on product discovery experience: Performance metrics track image rendering speed, collection loading latency, and UI responsiveness to prevent browsing friction in catalog-heavy storefronts.
- Checkout reliability under integration load: Metrics such as crash rate, API latency, and error frequency help identify failures across payment gateways, authentication layers, and shipping logic.
- Store sync dependency challenges: Real-time Shopify or backend sync introduces data latency risks; performance metrics ensure inventory, pricing, and cart states remain accurate without delay.
- Performance risks in catalog-dense apps: High SKU volumes increase memory consumption and network calls. Metrics validate component efficiency and prevent UI freezes during scrolling and filtering.
- Direct relationship between performance and revenue outcomes: Startup time, responsiveness, and stability influence session continuity, conversion readiness, and repeat purchase behavior in mobile commerce setups.
Having understood their essential impact, next, we dive into the top 10 mobile app performance metrics every ecommerce team must track.
Top 10 Mobile App Performance Metrics
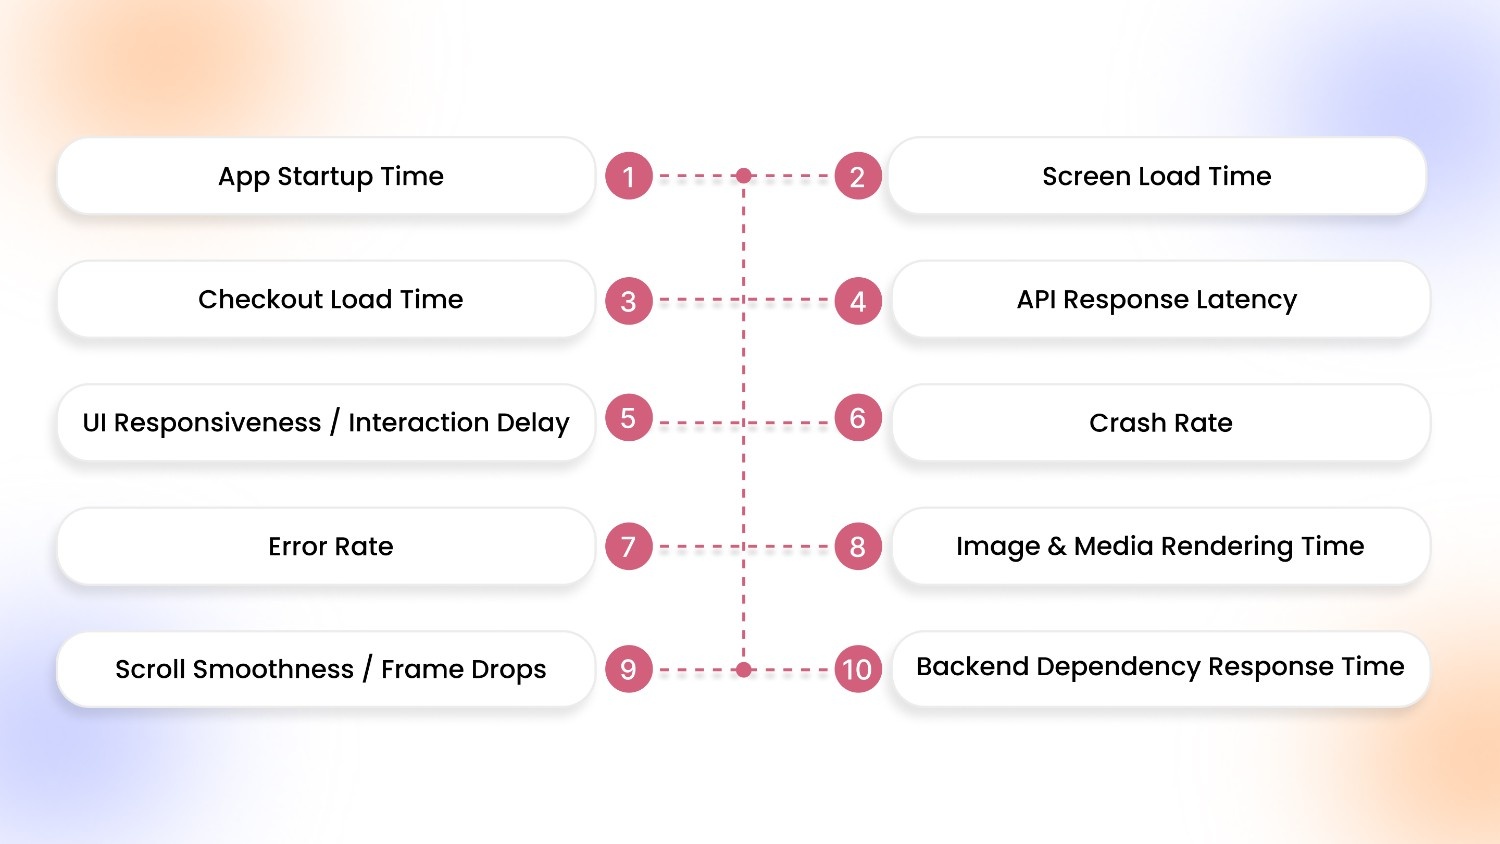
Tracking mobile app performance means focusing on metrics that reflect speed, stability, responsiveness, and runtime efficiency. The following performance metrics help ecommerce teams uncover friction across browsing, sync, and checkout flows.
1. App Startup Time
App startup time reflects how quickly users transition from launch intent to an interactive storefront across cold, warm, and hot states. Cold starts initialize resources from scratch, warm starts restore partial memory, while hot starts reopen instantly. Collectively, they shape perceived speed, trust signals, and first-touch interaction continuity.
For ecommerce apps, startup speed directly influences browsing momentum and campaign readiness. During repeat sessions or flash-sale traffic spikes, delayed launches slow product access, disrupt purchase intent, and increase abandonment risk before discovery even begins.
How to Measure App Startup Time: Track cold, warm, and hot starts from launch to first interactive screen using Time to Initial Render (TIR) and Time to Interactive (TTI) signals, across devices and network conditions.
2. Screen Load Time
Screen load time measures how quickly product listing pages (PLP) and product detail pages (PDP) render fully for users. Faster loading ensures smooth browsing, immediate access to products, and reduces friction between search, selection, and checkout. It directly influences the user’s perception of app speed and reliability.
Slow screens frustrate shoppers, causing abandonment and lower engagement, especially during high-traffic campaigns or large catalog browsing.
How to Measure Screen Load Time: Track the duration from page request to full render on PLP and PDP, using front-end performance tools across devices, network conditions, and app states to identify bottlenecks.
3. Checkout Load Time
Checkout load time reflects how quickly the checkout page becomes fully interactive after a user proceeds to purchase. Fast initialization ensures that cart details, payment options, and shipping selections appear without delay, maintaining trust and reducing friction during the final purchase steps.
Slow checkout load times directly increase cart abandonment, negatively impacting conversions and overall ecommerce revenue, especially during peak sale periods or promotional campaigns.
How to Measure Checkout Load Time: Track the time from checkout button tap to full interactivity of the checkout page using TIR and TTI metrics, tested across devices, OS versions, and network conditions to pinpoint delays.
4. API Response Latency
API response latency measures the time your app takes to receive data from backend services. This includes catalog sync, cart updates, and payment gateways. In ecommerce apps, delayed API responses can freeze product lists, prevent cart changes, or slow checkout confirmations, directly disrupting user flows.
High latency erodes trust, frustrates shoppers, and can cause drop-offs during high-demand periods or flash sales.
How to Measure API Response Latency: Monitor the round-trip time for key API calls, catalog fetch, cart update, and payment requests. Use backend performance tools, logging average, peak, and percentile latencies across devices and network conditions.
5. UI Responsiveness / Interaction Delay
UI responsiveness measures the time between a user action, like a tap, swipe, or button press and the app’s response. Delays in tap-to-action, sluggish button feedback, or choppy navigation disrupt browsing flow, reduce engagement, and frustrate shoppers.
For ecommerce apps, even milliseconds of lag can lead to abandoned searches, missed add-to-cart opportunities, and lower conversion rates during high-intent interactions.
How to Measure UI Responsiveness / Interaction Delay: Track input-to-display response time using front-end monitoring tools, measuring tap latency, button activation time, and screen navigation smoothness across devices and network conditions.
6. Crash Rate
Crash rate quantifies how often an ecommerce app terminates unexpectedly during key interactions, such as product browsing, cart updates, or checkout. High crash frequency disrupts session continuity, blocks purchases, and damages trust. It directly impacts conversion rates and lifetime customer value.
Even isolated crashes during payment or login flows can trigger permanent user churn.
How to Measure Crash Rate: Track the percentage of user sessions that end in a crash using tools like Firebase Crashlytics or Sentry. Segment by device type, OS version, app version, and critical flows like checkout or cart updates to pinpoint root causes.
7. Error Rate
Error rate tracks how often critical actions in your ecommerce app fail, like adding items to the cart, updating quantities, or processing payments. This can occur due to network hiccups, API timeouts, or backend failures.
These errors disrupt the shopping journey, confuse users, and directly impact revenue, especially during high-traffic events when every failed interaction risks abandonment.
How to Measure Error Rate: Monitor failed requests across cart updates, checkout flows, and API calls using tools like Firebase, Sentry, or Datadog. Segment by error type, device, OS, and app version to identify recurring bottlenecks and fix critical friction points.
8. Image & Media Rendering Time
Image and media rendering time shows how quickly product images, banners, and videos load and display in your ecommerce app. Slow rendering disrupts browsing, delays product discovery, and reduces engagement, especially in catalog-heavy apps or during rich media campaigns.
Users may abandon sessions if high-resolution images or promotional videos lag, directly affecting conversion and purchase intent.
How to Measure Image & Media Rendering Time: Track the duration from request to full visual display using front-end monitoring tools. Segment by asset type, resolution, device, and network conditions to pinpoint bottlenecks in catalog or media-heavy screens.
9. Scroll Smoothness / Frame Drops
Scroll smoothness measures how fluidly users can navigate through product feeds. Meanwhile, frame drops indicate interruptions in visual rendering during long catalog browsing.
Stuttering or dropped frames frustrate users, slow product discovery, and increase the likelihood of abandonment, especially on large or media-rich catalogs where smooth scrolling is critical for engagement.
How to Measure Scroll Smoothness / Frame Drops: Monitor frames per second (FPS) during scroll actions using performance profiling tools, tracking dropped frames and stutter frequency across devices, OS versions, and feed lengths to identify and fix rendering bottlenecks.
10. Backend Dependency Response Time
Backend dependency response time shows how quickly your ecommerce app communicates with critical services like Shopify, inventory systems, and pricing APIs.
Slow responses delay catalog updates, inventory visibility, and real-time pricing, disrupting product discovery and checkout reliability.
How to Measure Backend Dependency Response Time: Track request-to-response durations for all backend calls, segmenting by API type, endpoint, and server location. Monitor Shopify syncs, inventory updates, and pricing APIs using APM tools to detect bottlenecks and optimize real-time performance.
Tracking metrics is important, but building an app that performs well can be tricky. Tools like AppMaker let ecommerce brands convert stores into high-performance mobile apps with real-time Shopify sync, AI-assisted layouts, and push notifications; all designed to meet these performance benchmarks.
With these key metrics in mind, let’s examine the performance-impacted metrics that you can measure alongside these ten metrics.
What Are Some Key Performance-Impacted Metrics to Measure?
In ecommerce, slow apps cost you sales. Installs, DAU/MAU, session length, and screen views show whether performance issues are blocking discovery. Retention and churn reveal if technical friction drives buyers away before checkout. Tracking each of these metrics exposes the exact points where lag, crashes, or delays are hitting revenue and lets you fix them before profits slip:
- Installs / Downloads: Tracks how many users download your app from the store. High numbers signal effective acquisition campaigns, while drops may indicate performance concerns or poor first impressions affecting adoption.
- DAU / MAU (Daily / Monthly Active Users): Measures app engagement frequency. Low DAU/MAU ratios can reveal friction, crashes, or slow performance, preventing users from returning. It directly affects repeat visits and long-term ecommerce revenue.
- Session Length: Average time users spend per session. Short sessions can indicate slow loading screens, unresponsive elements, or navigation friction, limiting browsing and reducing the likelihood of conversions.
- Screen Views per Session: Counts pages visited per session. Fewer screen views suggest performance bottlenecks on catalog, product, or checkout screens, impacting discovery, upsells, and cross-selling opportunities.
- Retention Rate: Percentage of users returning after first use. Poor retention often stems from app crashes, laggy interactions, or slow product page rendering, hurting long-term engagement and customer lifetime value.
- Churn / Uninstall Rate: Tracks users who abandon or remove the app. High churn is a red flag for performance issues: slow load times, failed payments, or buggy experiences directly drive users away.
Once we identify which metrics reflect friction and revenue impact, we can discuss effective measurement approaches to ensure accurate, actionable insights.
Also Read: 9 High-Impact Mobile Customer Engagement Strategies in 2026
How to Measure Mobile App Performance Metrics Effectively?
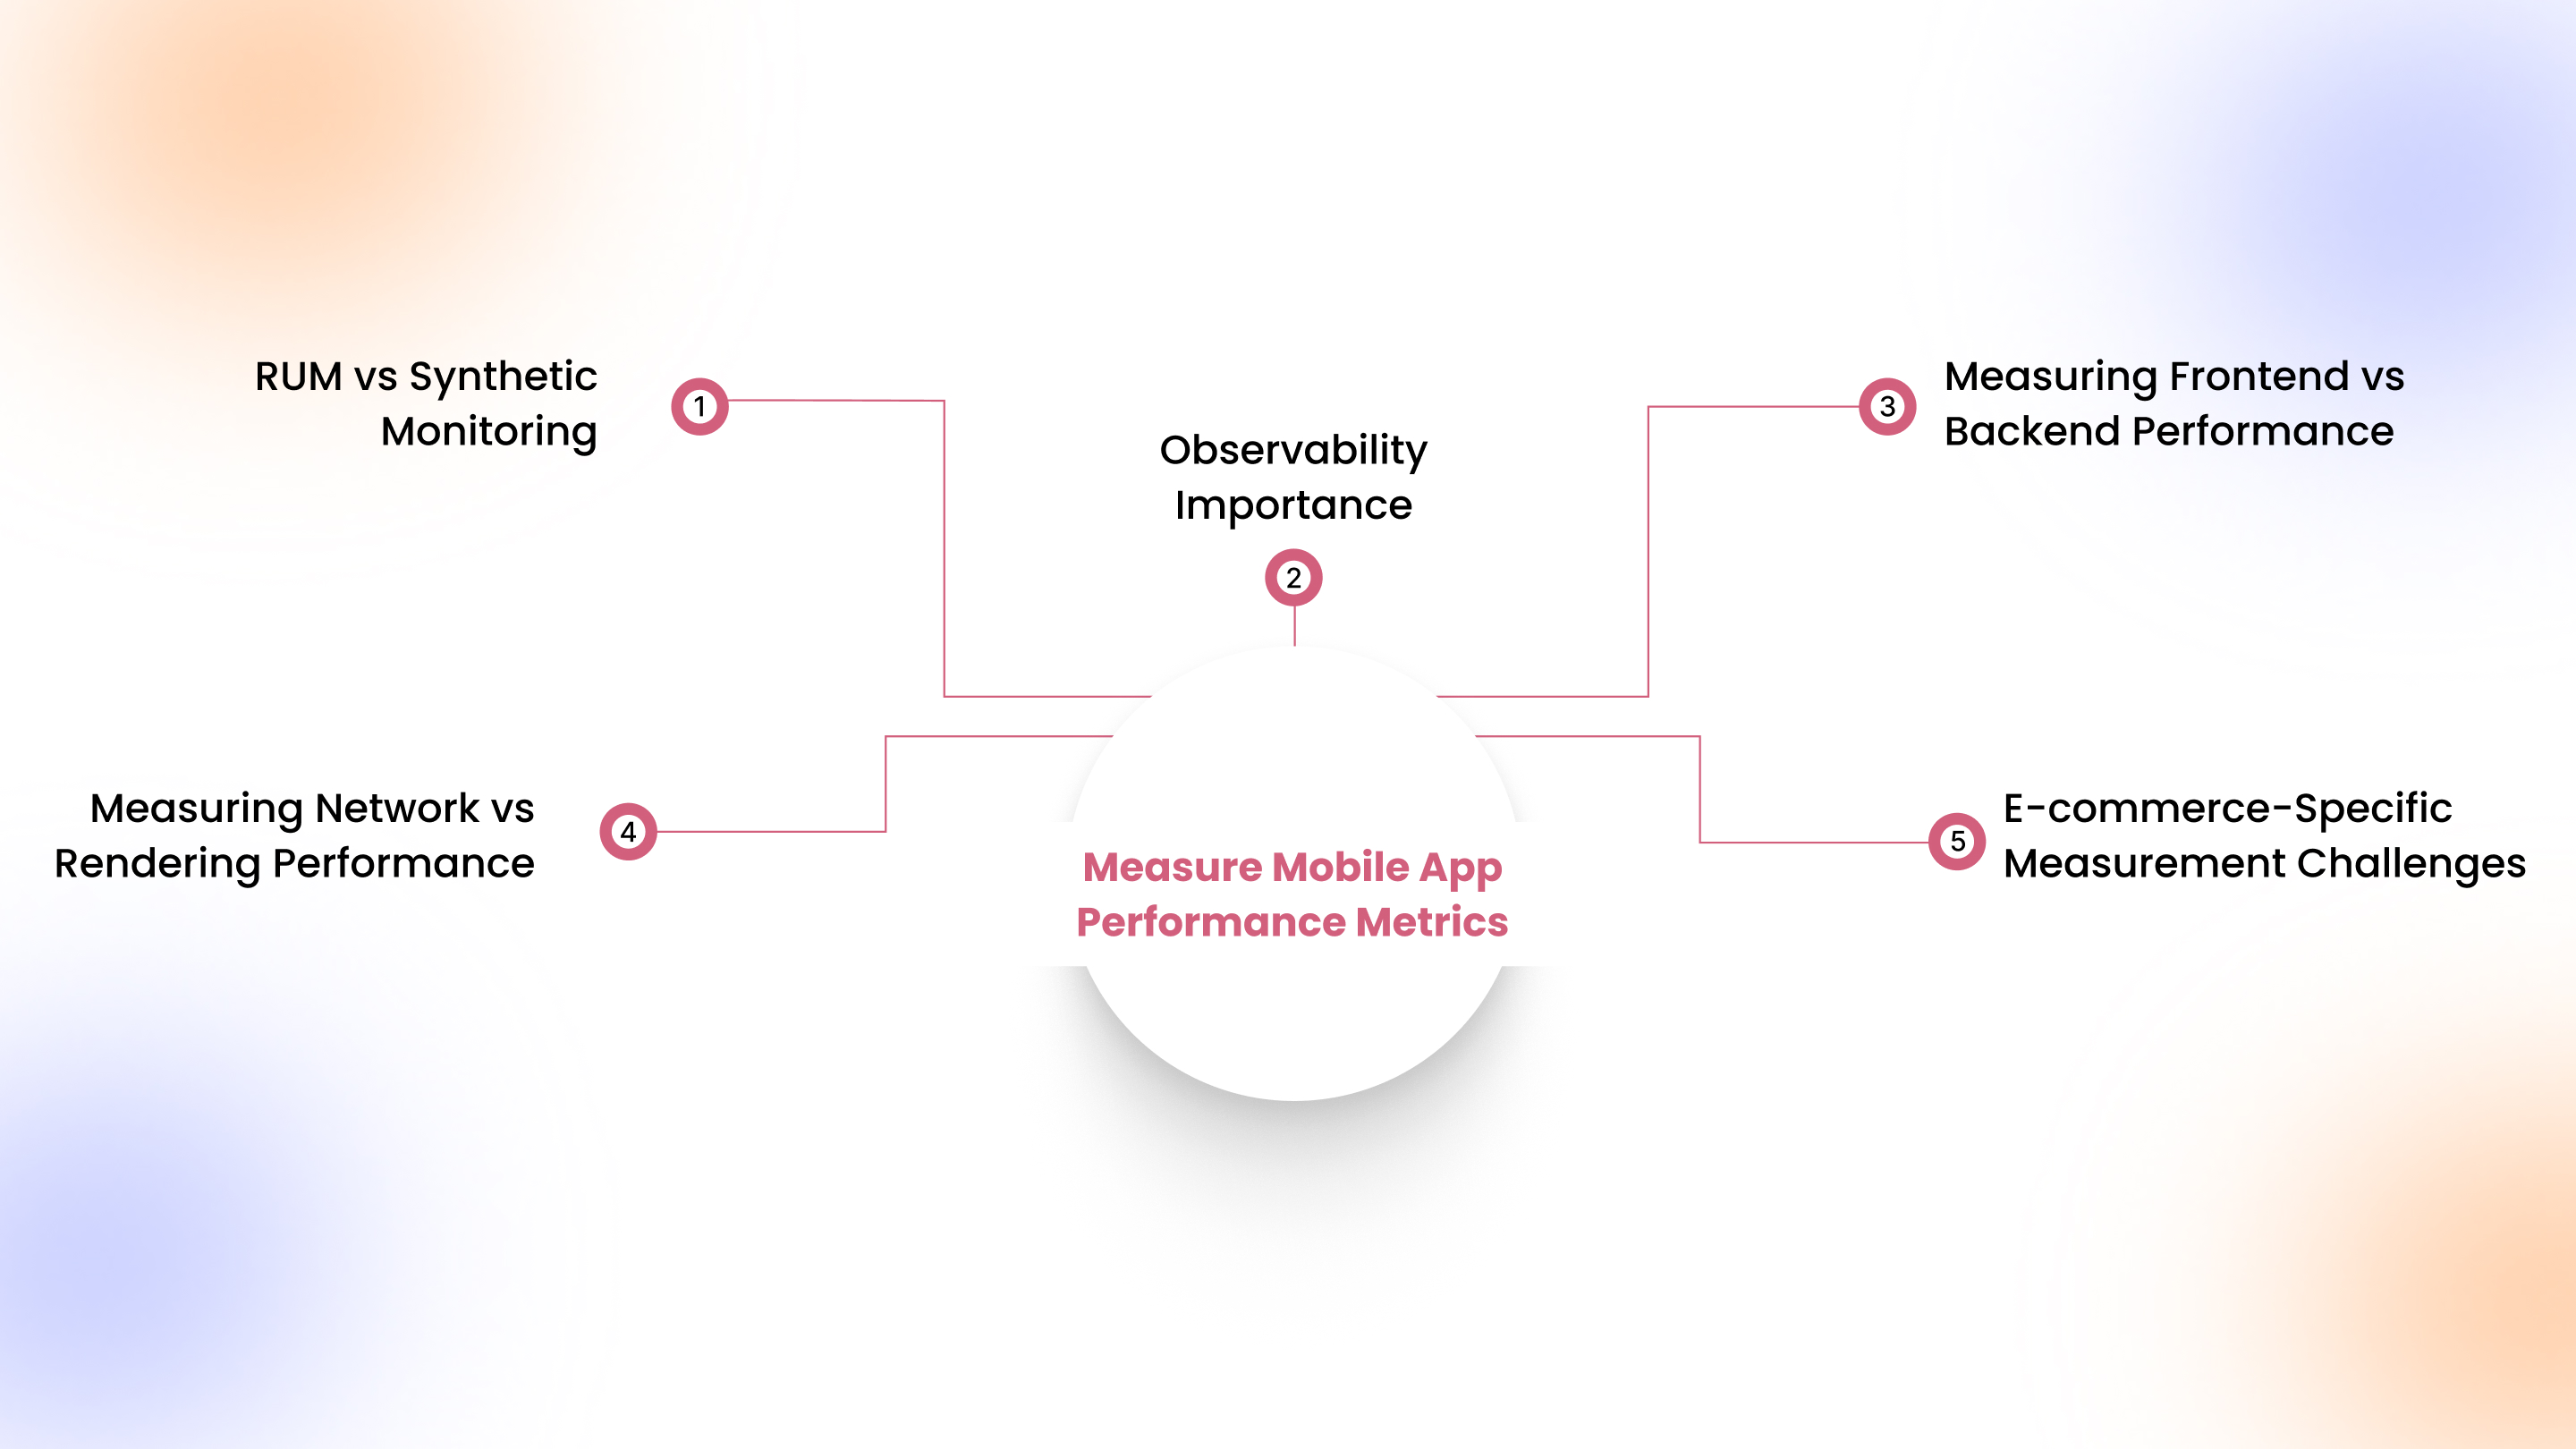
Measuring mobile app performance goes beyond simple dashboards; accurate insights come from combining the right monitoring techniques with e-commerce-specific context.
1. Real User Monitoring (RUM) vs Synthetic Monitoring
RUM captures real customer experiences across devices, networks, and sessions, revealing true friction points like slow catalog loads or checkout delays. Synthetic monitoring simulates controlled transactions, ideal for testing flash-sale readiness and frontend changes before release.
2. Observability Importance
End-to-end observability connects app performance, backend APIs, and third-party integrations. It allows you to trace slow product pages, cart sync issues, or delayed personalization responses in real-time.
3. Measuring Frontend vs Backend Performance
Track frontend metrics like screen rendering, image load, and interaction delays, while backend metrics cover API response times, database queries, and inventory sync. Both impact conversion velocity and user satisfaction.
4. Measuring Network vs Rendering Performance
Analyze network latency, packet loss, and server response times alongside rendering smoothness, frame drops, and interactive delays. Ecommerce users notice even minor interruptions, affecting discovery and purchase completion.
5. E-commerce-Specific Measurement Challenges
Complex catalogs, high-resolution media, personalization engines, and payment gateways make measurement tricky. Metrics must account for spikes during promotions, app variations across stores, and diverse mobile devices for accurate performance insights.
Having set up measurement strategies, it’s important to recognize common bottlenecks in ecommerce apps that degrade performance and disrupt user experience.
Common Mobile App Performance Bottlenecks in Ecommerce Apps
Even small inefficiencies in ecommerce apps can slow browsing, frustrate users, and hurt conversions. Key performance bottlenecks include:
- Heavy product catalogs: Large inventories with high-resolution images and videos overload memory. It delays navigation, product visibility, and interactive responsiveness during peak browsing sessions on mobile devices.
- Media-rich homepages: Hero banners, autoplay videos, and interactive widgets increase initial load time, causing user frustration before product discovery, and potentially lowering engagement and retention.
- Real-time personalization rendering: Dynamic recommendations, pricing updates, and inventory checks can stall content display if APIs and caching are not properly optimized for mobile performance.
- API dependency overload: Multiple external calls for payments, shipping, and analytics introduce latency spikes that disrupt smooth user flow and can cause app unresponsiveness during high-traffic moments.
- Checkout complexity: Multi-step forms, validations, and third-party gateway dependencies increase cart abandonment risk, especially when delays occur during critical purchase decision points for mobile users.
- Push campaign background tasks: Intensive notification or segmentation processes running in the background consume resources. This can impact responsiveness, draining device memory, and slowing other app interactions during user sessions.
Now that we know where friction occurs, let’s see how AppMaker helps you create mobile apps that are fast, stable, and conversion-ready, even for large product catalogs.
Also Read: Top 10 Mobile Apps for E-commerce Success in 2026
How AppMaker Helps Improve Mobile App Performance

While monitoring metrics is essential, building your app right from the start with the right tools ensures consistent performance. AppMaker enables ecommerce brands to create apps that perform reliably under real-world conditions. By focusing on startup speed, load times, and smooth interactions, AppMaker helps brands build apps that perform efficiently, supporting better user experiences and smoother browsing without technical complexity.
Here’s what AppMaker does:
- Deep Customization: Appmaker Studio gives brands full creative control, from UI/UX to integrations with code-level access and limitless flexibility.
- Eidolon AI: Converts Figma designs or screenshots into efficient, lightweight app layouts, minimizing initial render delays and improving startup responsiveness.
- John AI: Monitors interactions in real time, helping maintain responsive UI and smooth tap-to-action performance, while supporting analytics-informed improvements.
- Real-Time Shopify Sync: Ensures backend inventory, pricing, and cart updates happen efficiently without slowing down the app or blocking critical flows.
Together, these features ensure your ecommerce app delivers fast, stable, and seamless experiences that keep users engaged and satisfied.
Conclusion
Mobile app performance provides a seamless ecommerce experience. Metrics like crash rate, load times, and UI responsiveness highlight areas where friction slows discovery, browsing, and checkout. Regular monitoring of these metrics allows teams to proactively resolve issues before they impact engagement or revenue.
AppMaker not only helps build apps but also provides actionable insights into performance patterns. Its real-time analytics, automated optimization suggestions, and intelligent layout adjustments help identify performance bottlenecks. It helps in optimizing app responsiveness and maintaining smoother interactions across devices and typical traffic spikes.
For ecommerce brands aiming to boost conversions and retain users, contact our team to see how AppMaker can help improve your app’s performance and reliability.
FAQs
1. What is the most important mobile app performance metric?
App startup time is the most critical metric, as it directly impacts first impressions, perceived speed, and usability. Slow startups can increase abandonment and reduce repeat visits, especially during high-intent ecommerce browsing.
2. How do performance metrics affect ecommerce conversions?
Metrics like load time, crash rate, and UI responsiveness directly influence user trust, browsing continuity, and checkout success. Poor performance causes cart abandonment, missed flash-sale opportunities, and lower lifetime value for ecommerce apps.
3. How often should mobile app performance metrics be monitored?
Continuous monitoring is essential, with real-time dashboards for critical metrics like crashes, latency, and API performance. Weekly in-depth reviews help detect trends, while post-release spikes or campaigns require immediate scrutiny for optimization.
4. What tools help track mobile app performance metrics?
Tools like Firebase Performance, Dynatrace, AppDynamics, New Relic, and Sentry provide end-to-end insights into startup times, crashes, API latency, and rendering issues. They enable targeted improvements and actionable reporting for ecommerce mobile apps.