


Most ecommerce stores focus on getting people to their product pages, but many forget the next step: getting them to actually add items to the cart. This matters because even when shoppers are interested, they often stop before checkout. On average, 70.22% of carts are abandoned, meaning most visitors never make it to purchase.
When people add items but don’t buy, it points to problems in how your store engages and guides customers. Improving this step can make a big difference to your sales and grow long‑term revenue.
To do that, you first need to understand what the add‑to‑cart rate really is, why it matters, what affects it, and how to measure and improve it effectively. In this blog, we will walk through all of these.
Overview
- Add-to-cart rate captures early shopper intent and highlights friction points before checkout, serving as an important metric for understanding engagement and purchase readiness.
- Product appeal, pricing, UX, trust signals, and personalization are primary drivers of add-to-cart performance and directly influence shopper behavior.
- Optimizing product pages, simplifying navigation, and using AI-driven recommendations significantly increase the likelihood of items being added to carts.
- Behavioral analytics, heatmaps, and multi-channel nudges provide actionable insights to identify drop-off points and improve shopper flow throughout the funnel.
- Cross-metric analysis, reporting, and continuous monitoring ensure brands can align add-to-cart strategies with revenue, funnel efficiency, and merchandising decisions effectively.
What is the Add-to-Cart Rate?
Add-to-Cart Rate measures the percentage of visitors who add a product to their shopping cart during a session. It’s a critical early-funnel metric showing customer interest and purchase intent, allowing merchants to spot friction points before checkout.
Unlike conversion rate (completed purchases) or checkout rate (users starting checkout), add-to-cart captures the first real commitment to buy. By tracking this metric, brands can quickly identify underperforming products, optimize pages, and implement fast improvements to boost engagement and sales, turning browsing visitors into potential buyers.
Having clarified what the add-to-cart rate represents, let’s examine why it’s essential for your store’s growth.
Also Read: Push Notification Strategy: 9 Best Practices to Drive Engagement in 2026
Why Does the Add-to-Cart Rate Matter for Your Store?
Monitoring your add-to-cart rate is essential for any online store, as it reveals how effectively your products, pricing, and website experience drive customer interest. It enables you to make targeted improvements that directly increase engagement and potential sales.
1. Indicator of Product-Market Fit and Pricing Effectiveness
A strong add-to-cart rate shows your store’s products and pricing resonate with your target customers. Low rates reveal mismatched offerings or pricing gaps, guiding you to refine selection, adjust price points, or test promotions that drive immediate app engagement.
2. Helps Identify Friction Points in UX and Navigation
Tracking the add-to-cart rate pinpoints where users abandon before adding items. Slow pages, unclear CTAs, or confusing navigation become visible, allowing your store to remove obstacles, improve layout, and make product discovery seamless.
3. Predicts Revenue Potential and Impacts Marketing ROI
Add-to-cart rate gives early insight into sales performance. Stores can forecast revenue from interested shoppers, allocate marketing budgets effectively, and focus campaigns on high-intent products, maximizing ROI while reducing wasted ad spend.
4. Supports Data-Driven Decision Making for Merchandising and Promotions
Analyzing add-to-cart trends helps your store optimize product placement, bundles, and promotions. Data-driven actions ensure merchandising aligns with customer intent, boosting engagement, increasing average order value, and improving the likelihood of completed purchases.
Once you recognize its significance, the next step is understanding how to measure the add-to-cart rate accurately to identify improvement opportunities.
How to Calculate Add-to-Cart Rate?
Calculating your add-to-cart rate helps you understand shopper intent and spot opportunities to boost sales. The formula to calculate the add-to-cart rate is:
Sessions with a product added ÷ Total sessions × 100
For example, if 250 sessions resulted in a product being added to the cart out of 2,500 total sessions, your add-to-cart rate is 10%.
You can measure it in different ways: per session shows overall engagement, per visitor tracks repeat shoppers, and per product highlights top-performing items. Monitoring these metrics helps you identify underperforming products, optimize pricing, improve marketing campaigns, and enhance the shopping experience to convert more visitors into buyers.
After learning how to calculate the add-to-cart rate, it’s essential to compare your performance against industry benchmarks to spot gaps and guide optimization.
Benchmarks: Good vs. Bad Add-to-Cart Rate
A good add-to-cart rate typically indicates strong product appeal and user engagement, often falling between 2–10% for most ecommerce stores. A bad add-to-cart rate signals friction in UX, unclear product pages, or misaligned pricing, usually below 2%, highlighting areas that need immediate optimization.
Add-to-Cart Rate by Industry
Industry type significantly impacts add-to-cart performance. Categories with lower price points and habitual buying, like beauty or multi-brand retail, generally see higher rates. Luxury or high-consideration products often have lower rates due to longer decision cycles.
Add-to-Cart Rate by Location
Geography influences shopping behavior. Regional variations reflect cultural shopping habits, purchasing power, and device usage patterns. For example, Americas show slightly higher rates than APAC due to familiarity with online shopping and faster mobile adoption.
Add-to-Cart Rate by Device Type
Device type affects user experience and engagement. Mobile users often browse casually, while desktop users may engage more deliberately.
Note: Data sourced from Ecommerce Benchmarks by XP2, compiled by Dynamic Yield.
Having assessed what’s good and bad, we now explore the key factors that drive add-to-cart performance and influence shopper behavior.
Factors Influencing Add-to-Cart Rate
Several factors directly impact your store’s add-to-cart performance. Understanding these elements can significantly boost shopper intent and conversion potential. These factors include:
1. Product Factors: Type, Price, Availability, Bundle Offers
Product characteristics drive shopper behavior. High-demand, low-cost, or frequently purchased items naturally attract ads. Bundles and availability alerts increase perceived value, while out-of-stock products or niche items can suppress add-to-cart rates, guiding inventory and promotion decisions.
2. UX/UI and Site Performance: Navigation, Page Speed, Mobile Responsiveness
Smooth navigation, fast-loading pages, and mobile-optimized layouts reduce friction and make it easy for shoppers to add items. Poor UX or slow responsiveness frustrates users, lowering add-to-cart actions and negatively impacting early-funnel purchase intent.
3. Pricing Strategies, Discounts, and Promotions
Competitive pricing, targeted discounts, and time-sensitive promotions can motivate users to add items to the cart immediately. Misaligned pricing or inconsistent discounts may reduce intent, making strategic pricing experiments critical for maximizing add-to-cart conversions.
4. Customer Trust & Social Proof: Reviews, Ratings, UGC
Trust signals like product reviews, star ratings, and user-generated content (UGC) reassure shoppers of quality and credibility. Strong social proof increases confidence in purchasing decisions, directly driving higher add-to-cart actions across products.
5. Personalization and Behavioral Triggers
AI-powered personalization dynamically surfaces relevant products, recommendations, or offers based on browsing behavior. Behavioral triggers like recently viewed items or cart reminders create urgency and relevance, nudging visitors toward adding products to the cart.
Once you know what affects the add-to-cart rate, it’s time to take actionable steps, starting with optimizing product pages for clarity, trust, and engagement.
Also Read: 9 High-Impact Mobile Customer Engagement Strategies in 2026
8 Strategies to Improve Add-to-Cart Rate
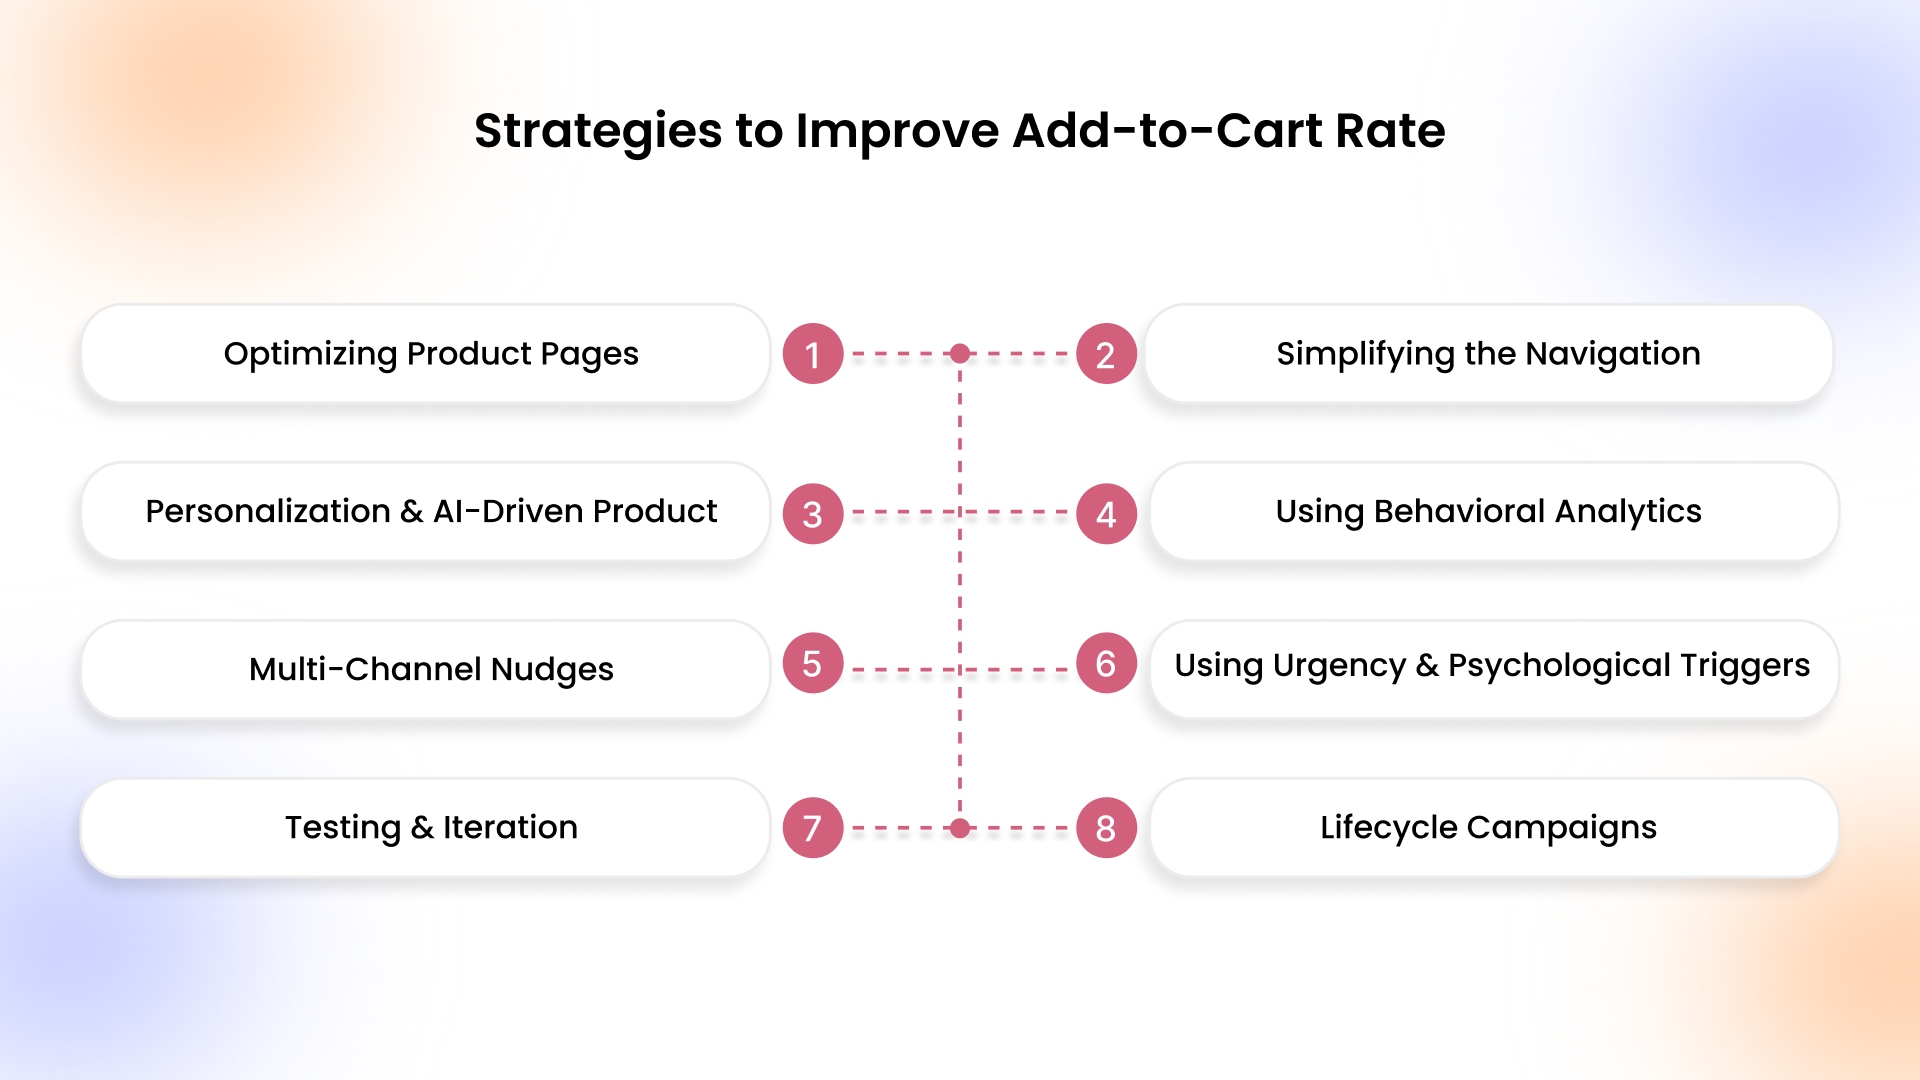
To maximize your store’s sales potential, taking a strategic approach to add-to-cart optimization is essential. The following strategies can help you guide shoppers smoothly, increase engagement, and turn browsing into meaningful cart additions.
1. Optimizing Product Pages: Visuals, Descriptions, CTAs, Trust Signals
A high-performing product page is critical for driving add-to-cart actions. Shoppers need clarity, confidence, and motivation to act. Optimized visuals, compelling descriptions, strong CTAs, and trust signals reduce hesitation and increase conversion likelihood.
How Brands Can Execute:
- Use high-resolution images with zoom, 360° views, and lifestyle context to help shoppers visualize usage.
- Write concise, benefit-driven product descriptions highlighting features and solving shopper pain points.
- Place prominent, action-oriented CTAs like “Add to Cart” near images and above the fold.
- Display verified reviews, ratings, trust badges, and stock availability to build credibility and reduce uncertainty.
2. Simplifying the Navigation & Checkout Process
Navigation and checkout friction directly reduce add-to-cart rates. Simplifying pathways, minimizing clicks, and ensuring smooth flow encourage shoppers to complete actions without hesitation.
How Brands Can Execute:
- Implement intuitive category-based menus and auto-suggest search with filters for faster product discovery.
- Reduce checkout steps and enable guest checkout to remove barriers for first-time visitors.
- Keep the cart visible across pages so users always know their selected items.
- Optimize device-specific navigation paths to remove friction on mobile and desktop.
3. Personalization and AI-Driven Product Recommendations
Tailored recommendations improve relevancy and increase perceived value. AI-driven suggestions ensure each visitor sees products most likely to resonate, boosting the chance of adding to cart.
How Brands Can Execute:
- Show recently viewed, complementary, or related products dynamically on product and cart pages.
- Use AI to surface trending or high-converting items based on individual visitor behavior.
- Personalize homepage, category, and product suggestions for returning shoppers based on past activity.
- Promote bundles, cross-sells, or upsells triggered by browsing and purchase patterns to increase AOV.
4. Using Behavioral Analytics and Heatmaps to Identify Friction
Understanding exactly where shoppers hesitate or drop off is essential. Behavioral analytics and heatmaps reveal navigation pain points, friction in product discovery, or checkout challenges, helping brands optimize add-to-cart performance.
How Brands Can Execute:
- Track scroll depth, clicks, and hover behavior to identify product or page elements causing hesitation.
- Analyze cart abandonment points to access layout or UX issues blocking add-to-cart actions.
- Use session recordings to observe how real users interact with product pages and checkout.
- Segment insights by device type to address mobile-specific or desktop-specific friction efficiently.
5. Multi-Channel Nudges: Email, Push Notifications, Retargeting
Engaging shoppers across multiple channels reminds them of products and motivates them to add to the cart. Consistent, timely messaging reduces abandonment and drives conversions.
How Brands Can Execute:
- Send abandoned cart emails featuring personalized product images and recommendations.
- Trigger push notifications through AppMaker to alert users about back-in-stock items, flash sales, or expiring promotions, directly re-engaging them within your branded mobile app.
- Use retargeting ads on social and display platforms to re-engage visitors who viewed products but didn’t add them.
- Coordinate timing across channels to avoid overwhelming users while maintaining consistent messaging.
6. Using Urgency and Psychological Triggers Ethically
Urgency and scarcity drive action when used transparently. Ethical implementation builds trust while nudging shoppers to act, increasing add-to-cart rates without manipulative tactics.
How Brands Can Execute:
- Highlight low-stock products with live inventory counts to encourage faster decisions.
- Display limited-time offers using clear countdown timers to create genuine urgency.
- Showcase best-selling or trending items to utilize social validation.
- Avoid fake scarcity; always maintain transparency to preserve trust and brand reputation.
7. Testing & Iteration: A/B Testing, Continuous Optimization
Continuous testing ensures your store grows with shopper behavior. Iterative experiments reveal which layouts, CTAs, or page elements maximize add-to-cart rates.
How Brands Can Execute:
- Run A/B tests on CTA placement, wording, and color to find the most effective combinations.
- Test different product page layouts, image sizes, and description formats to optimize engagement.
- Implement winning variations across the site for consistency and improved results.
- Reassess periodically, especially during seasonal shifts, new product launches, or traffic changes.
8. Lifecycle Campaigns and Retention-Focused Nudges
Add-to-cart optimization isn’t just about first-time visitors. Engaging repeat customers with tailored lifecycle campaigns encourages frequent purchases, boosts retention, and increases long-term revenue while maintaining high add-to-cart rates.
How Brands Can Execute:
- Segment shoppers based on purchase frequency, past product interactions, and engagement to deliver highly relevant campaigns.
- Send personalized recommendations highlighting complementary or replenishable products based on previous orders.
- Implement loyalty programs or repeat-purchase incentives that encourage customers to return and add more items to their cart.
- Automate timely reminders for seasonal products, subscriptions, or limited-stock favorites to maintain ongoing shopper engagement.
Having seen all the above strategies, it’s time to learn monitoring-related metrics and reporting to see the impact on checkout, purchases, and overall revenue.
Add-to-Cart Rate and Related Metrics
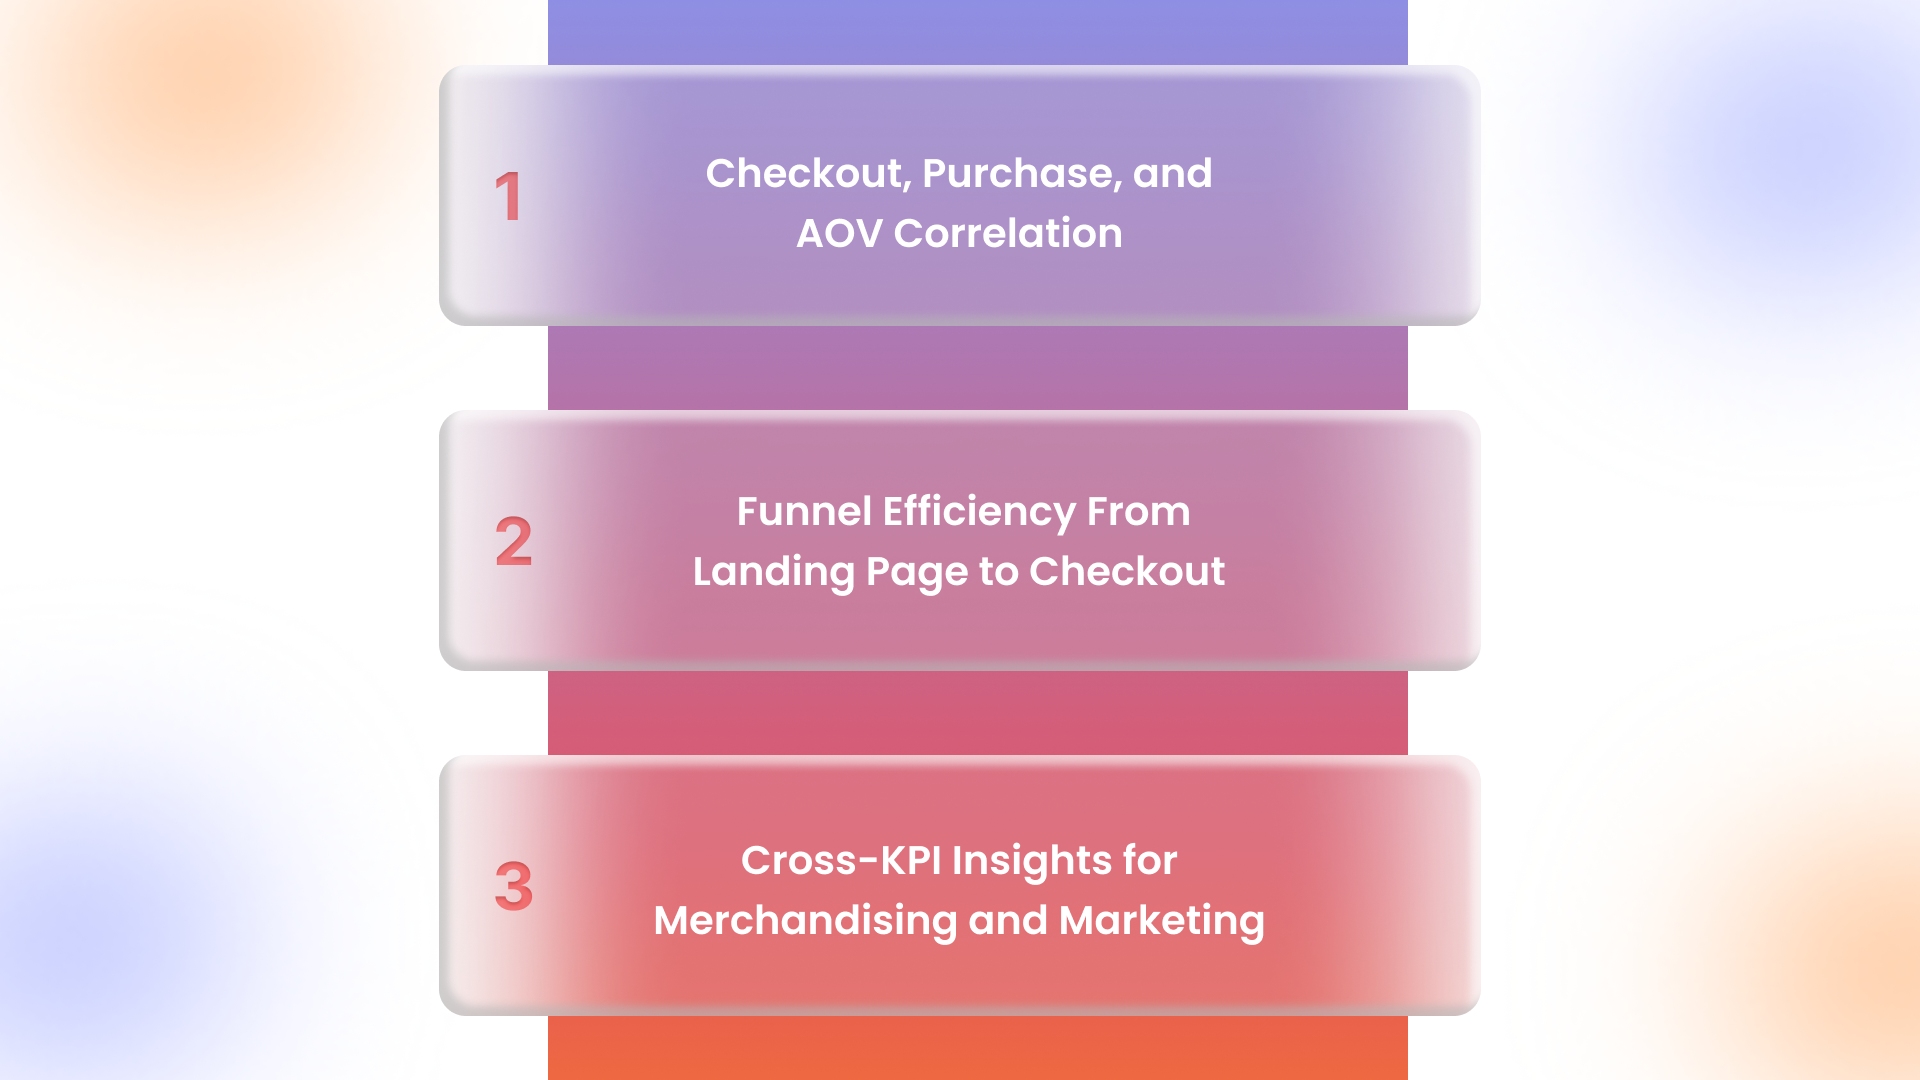
Understanding the add-to-cart rate in isolation isn’t enough. Its true value comes from analyzing how it connects with other key metrics, helping brands optimize the entire funnel, increase revenue, and make data-driven merchandising and marketing decisions.
1. Checkout, Purchase, and AOV Correlation
Add-to-cart rate reflects early shopper intent, but its impact depends on how many adds become purchases and influence average order value. Monitoring these correlations helps brands identify bottlenecks, optimize pricing, prioritize high-value products, and improve overall revenue performance efficiently.
2. Funnel Efficiency From Landing Page to Checkout
Tracking the journey from landing page to add-to-cart and checkout uncovers where shoppers hesitate or drop off. This insight allows brands to refine product messaging, simplify navigation, and optimize checkout processes, boosting funnel efficiency and increasing conversions across devices and channels.
3. Cross-KPI Insights for Merchandising and Marketing
Analyzing add-to-cart alongside KPIs like retention, repeat purchases, and traffic sources provides actionable insights. Brands can use this data to optimize merchandising, refine promotions, target high-value segments, and design marketing campaigns that increase both cart additions and overall revenue.
Now that we’ve explored how the add-to-cart rate connects with various metrics, let’s examine how to track, report, and act on these metrics for maximum impact.
Also Read: 10 Smart Ways to Promote Your Shopify Store in 2026
Reporting and Analytics for Add-to-Cart Optimization
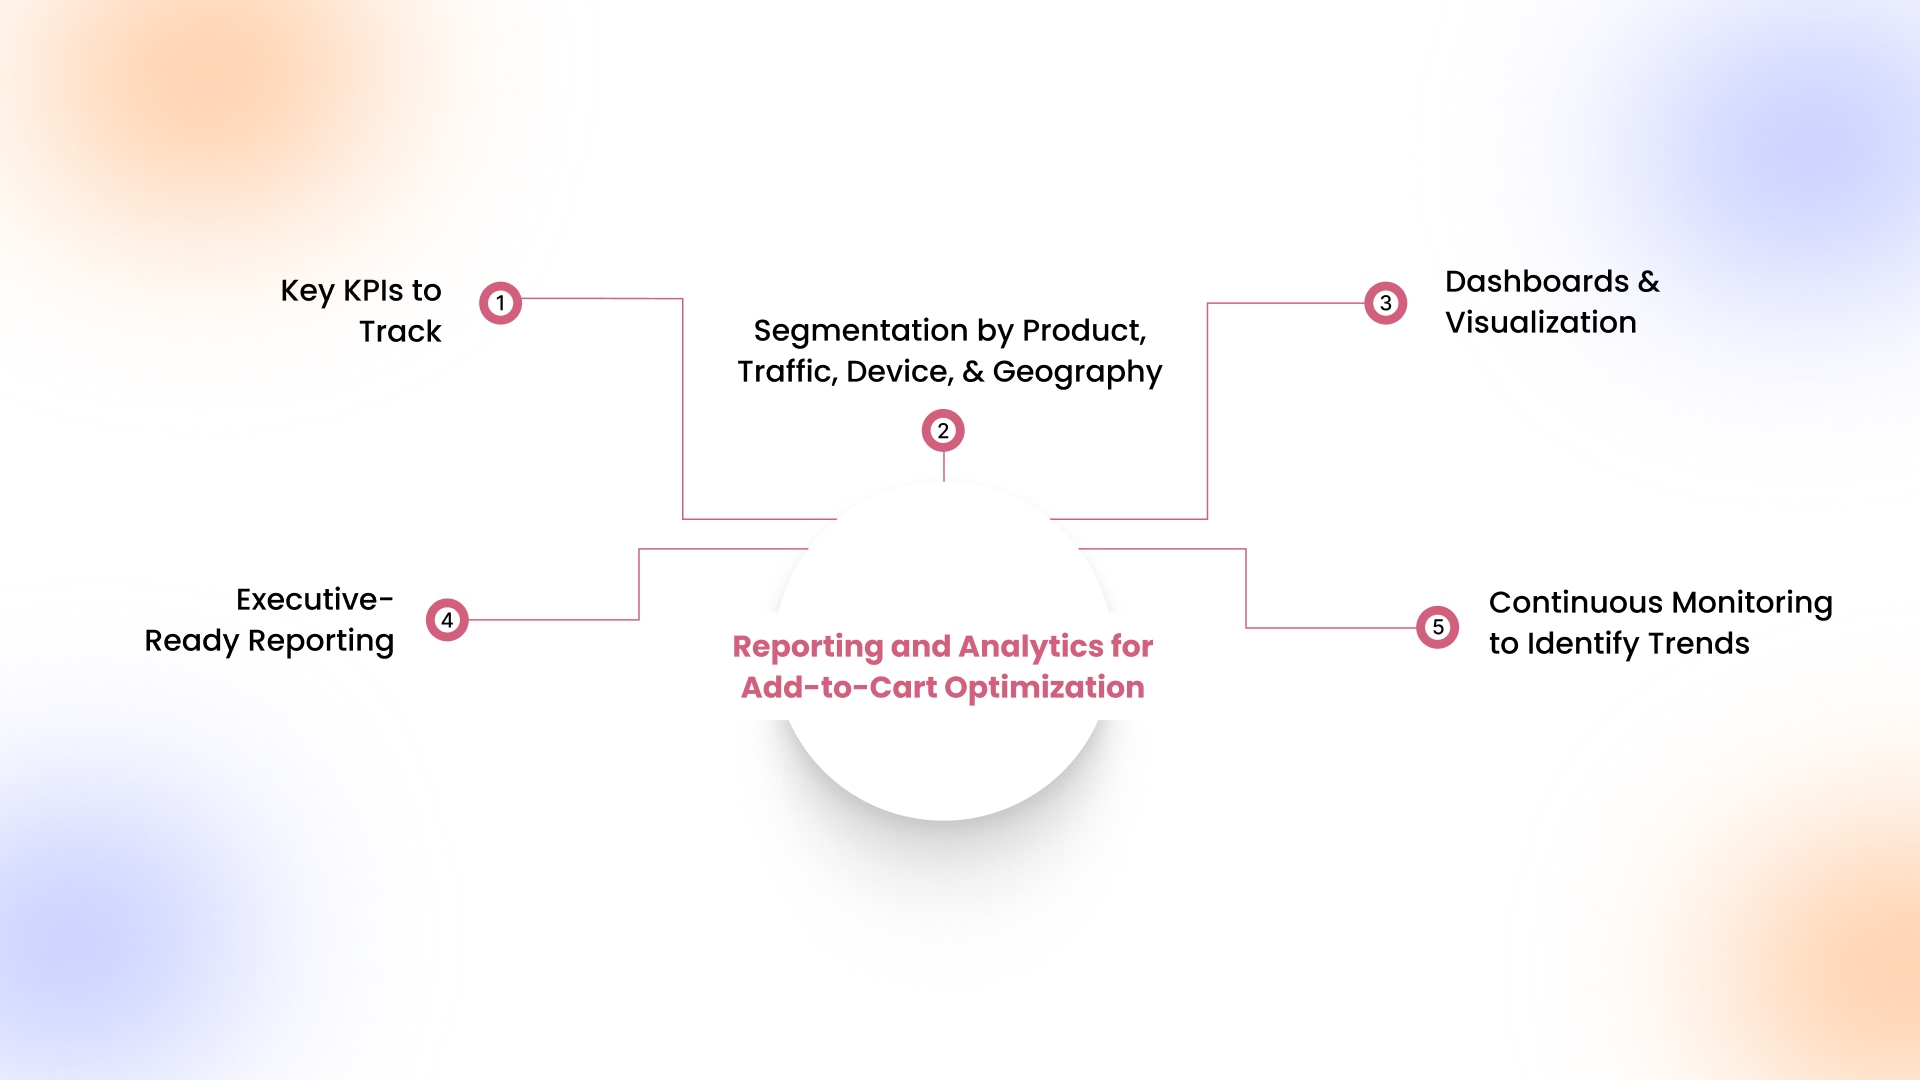
Accurate reporting and analytics are essential for understanding shopper behavior and improving add-to-cart performance. By tracking key KPIs, segmenting data, and visualizing trends, brands can pinpoint friction points, optimize campaigns, and make data-driven decisions that directly boost conversions and revenue.
1. Key KPIs to Track
Beyond the add-to-cart rate, track checkout completion, purchase conversion, AOV, repeat purchase rate, and cart abandonment. Comparing these KPIs per product and campaign reveals bottlenecks, guides promotional strategies, and helps optimize high-traffic pages for maximum shopper engagement and revenue impact.
2. Segmentation by Product, Traffic, Device, and Geography
Analyze add-to-cart by product category, traffic source, device type, and region to uncover behavior differences. Segment-specific insights let brands personalize offers, prioritize merchandising, optimize device layouts, and tailor campaigns for regions, driving higher engagement and conversion rates.
3. Dashboards and Visualization
Centralize metrics in GA4, Shopify, WooCommerce, or Stripe dashboards to visualize add-to-cart alongside conversion, retention, and AOV. Heatmaps, funnel charts, and trend lines highlight friction points, low-performing products, and seasonal shifts, enabling precise, data-driven optimization decisions.
4. Executive-Ready Reporting and Actionable Insights
Reports should summarize add-to-cart trends, high-performing products, and friction points. Include insights on campaigns, traffic sources, and customer segments, with clear recommendations for optimizations. This ensures leadership can make strategic merchandising and marketing decisions quickly and confidently.
5. Continuous Monitoring to Identify Trends
Track add-to-cart across sessions, devices, and campaigns to detect emerging trends or seasonal fluctuations. Continuous monitoring identifies underperforming pages, informs A/B tests, and allows brands to adjust offers, product placement, and messaging in real time to maximize conversions.
Once you understand how metrics tie to revenue, let’s explore how AppMaker’s tools can enhance your mobile experience and improve add-to-cart performance.
How AppMaker Can Help Improve Your Add-to-Cart Rate
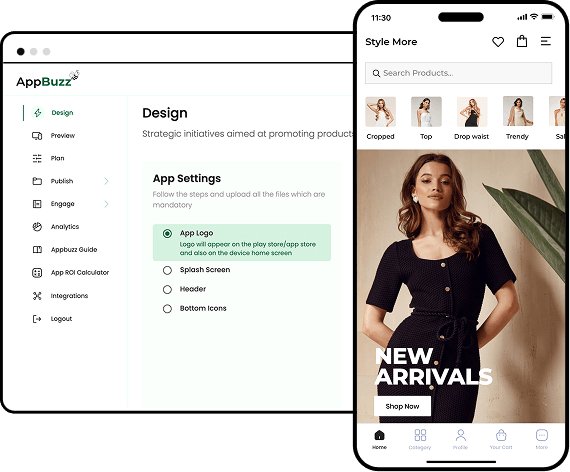
AppMaker provides ecommerce brands with the tools to turn their Shopify store into a fully branded mobile app that actually drives conversions. By focusing on user experience, personalization, and seamless integration, AppMaker helps businesses identify friction points and optimize the path to add to cart, making the shopping journey smoother and more engaging.
With AppMaker, brands can use key features to enhance performance:
- Eidolon AI: Automatically converts Figma or screenshot designs into fully functional app layouts, making product pages visually appealing and easy to navigate.
- John AI: Provides real-time insights on product trends, user behavior, and cart abandonment, helping you act on data quickly.
- Push Notifications: Target users with relevant updates, promotions, or cart reminders to boost engagement.
- Deep Customization: Appmaker Studio gives brands full creative control, from UI/UX to integrations with code-level access and limitless flexibility.
Together, these tools make it easier to improve shopper intent, increase add-to-cart actions, and maintain a consistent, data-driven mobile experience.
Conclusion
Improving the add-to-cart rate gives you a clear view of how shoppers interact with your store. By tracking trends, analyzing which products are most added, and spotting friction points, you can make small changes that drive more items into carts and eventually increase sales.
AppMaker helps by letting you manage your Shopify store from a mobile app. You can update products and content in real time, monitor which items are performing best, and use push notifications to re-engage users. This makes it easier to understand shopper behavior and adjust your store without waiting on developers.
If you want to see a real impact on your add-to-cart performance, reach out to AppMaker now!
FAQs
1. How does the add-to-cart rate correlate with revenue?
Add-to-cart rate serves as an early indicator of purchase intent. Higher rates generally signal stronger engagement and demand, which often lead to increased revenue, while low rates may highlight friction points or misaligned pricing, product placement, or marketing efforts.
2. What is a reasonable goal for new vs. established stores?
For new stores, an add-to-cart rate around 2–4% is typical while focusing on improving UX and product-market fit. Established stores can aim for 6–10% by using personalization, optimized campaigns, and insights from past data.
3. Can discounts hurt the add-to-cart rate?
Discounts can sometimes reduce perceived product value if overused or poorly targeted, which may lower add-to-cart actions. Carefully timed offers, loyalty incentives, and limited promotions can increase engagement without negatively impacting shopper intent or long-term brand perception.
4. How often should add-to-cart metrics be reviewed?
Add-to-cart metrics benefit from regular monitoring: daily to track campaign performance, weekly for product-level insights, and monthly for trends. This approach helps brands identify friction points, optimize strategies, and make informed decisions for consistent growth.